empty
27.06.2025 11:22 AM
Forecast for EUR/USD on June 27, 2025
On Thursday, the EUR/USD pair continued its upward movement and reached the 127.2% Fibonacci retracement level at 1.1712. A rebound from this level would favor the U.S. dollar and a potential decline toward the 1.1645 and 1.1574 levels. A daily close above 1.1712 would increase the likelihood of further growth toward the next level at 1.1802. So far, bears are showing no intention to reenter the market.

This image is no longer relevant

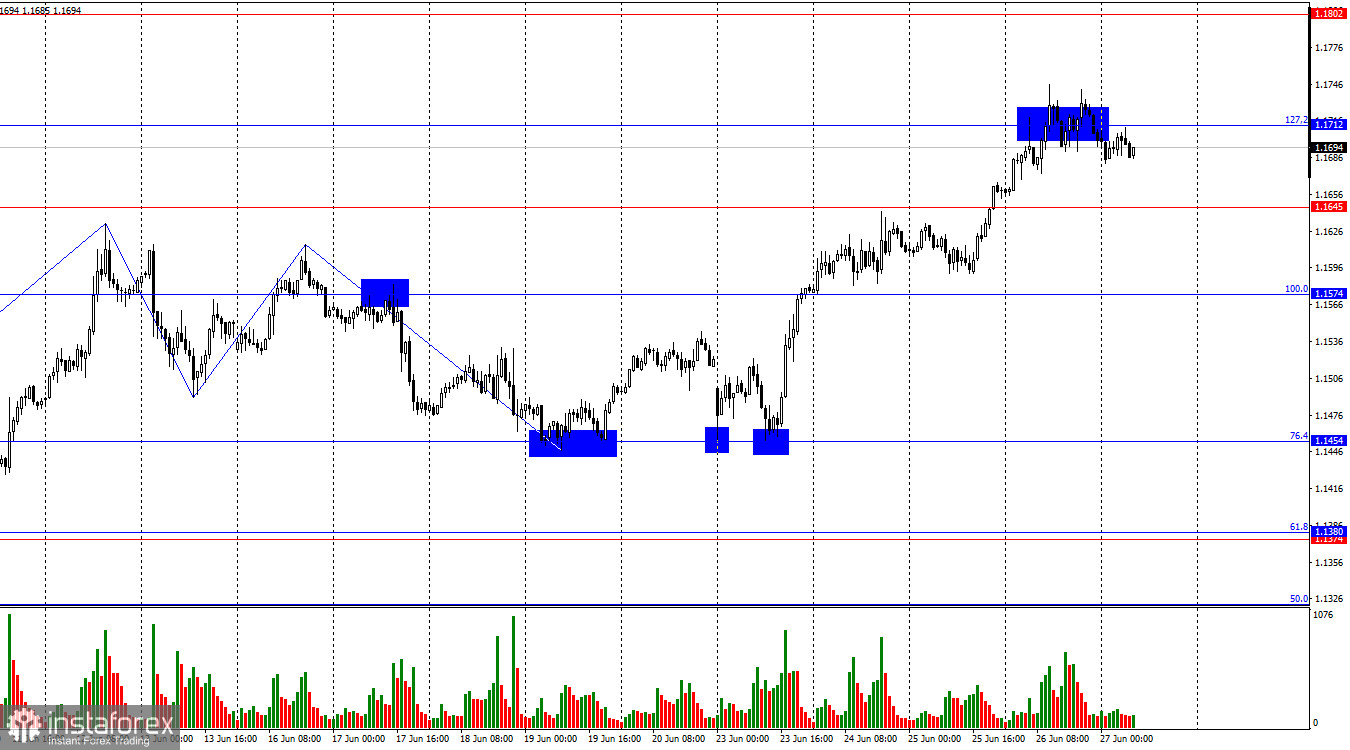
The wave pattern on the hourly chart remains simple and clear. The last completed downward wave broke slightly below the previous low, while the new upward wave easily surpassed the previous peak. Thus, the trend has once again shifted to bullish. The lack of progress in U.S.–China and U.S.–EU negotiations, the Fed meeting that didn't help the dollar, and the Middle East conflict that brought no benefit to the U.S. currency are all contributing to bearish hesitation. As expected, the bearish trend turned out to be short-lived and weak.

Thursday's news background was notable but mixed. The U.S. GDP report and durable goods orders data produced completely opposite results. While the U.S. economy contracted by 0.5% in Q1, durable goods orders surged by 16.4% m/m—twice the expected pace. In my view, the GDP report is far more important and points to a serious negative trend in the U.S. economy. Durable goods data, by contrast, reflects more of a one-off pattern than a structural shift. In addition to these reports, bulls had enough supportive headlines to continue their rally. Trump has once again floated the idea of firing Jerome Powell and continues to harshly criticize the Federal Reserve. Therefore, I believe a close above 1.1712 will allow bulls to maintain their offensive into Friday.

This image is no longer relevant

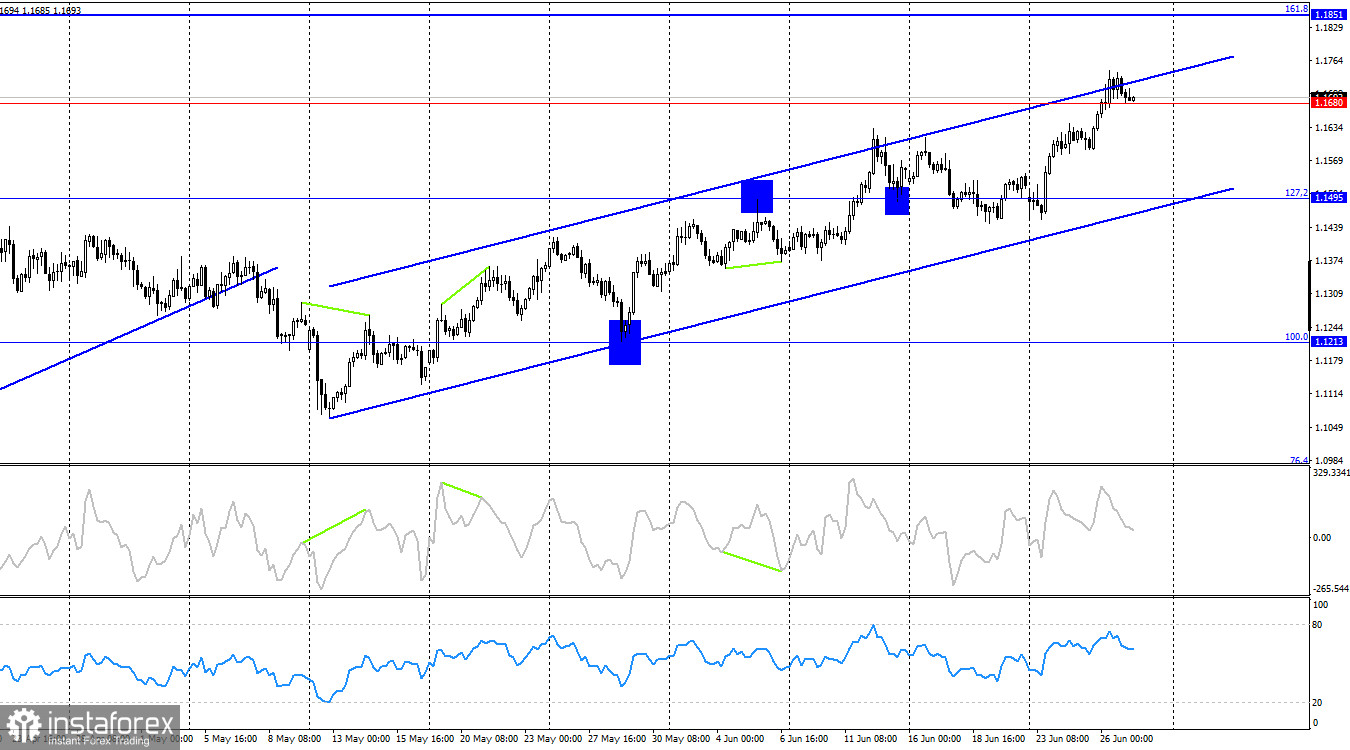
On the 4-hour chart, the pair reached the 1.1680 level. A sustained break below this level would favor the U.S. dollar and open the way to a decline toward the 127.2% Fibonacci level at 1.1495. However, the bullish trend within the ascending channel remains intact, and the dollar has little chance for a significant recovery. A firm close above 1.1680 would suggest further growth toward the 161.8% Fibonacci level at 1.1851. Currently, no signs of divergence are visible on any indicator.

Commitments of Traders (COT) Report:

This image is no longer relevant

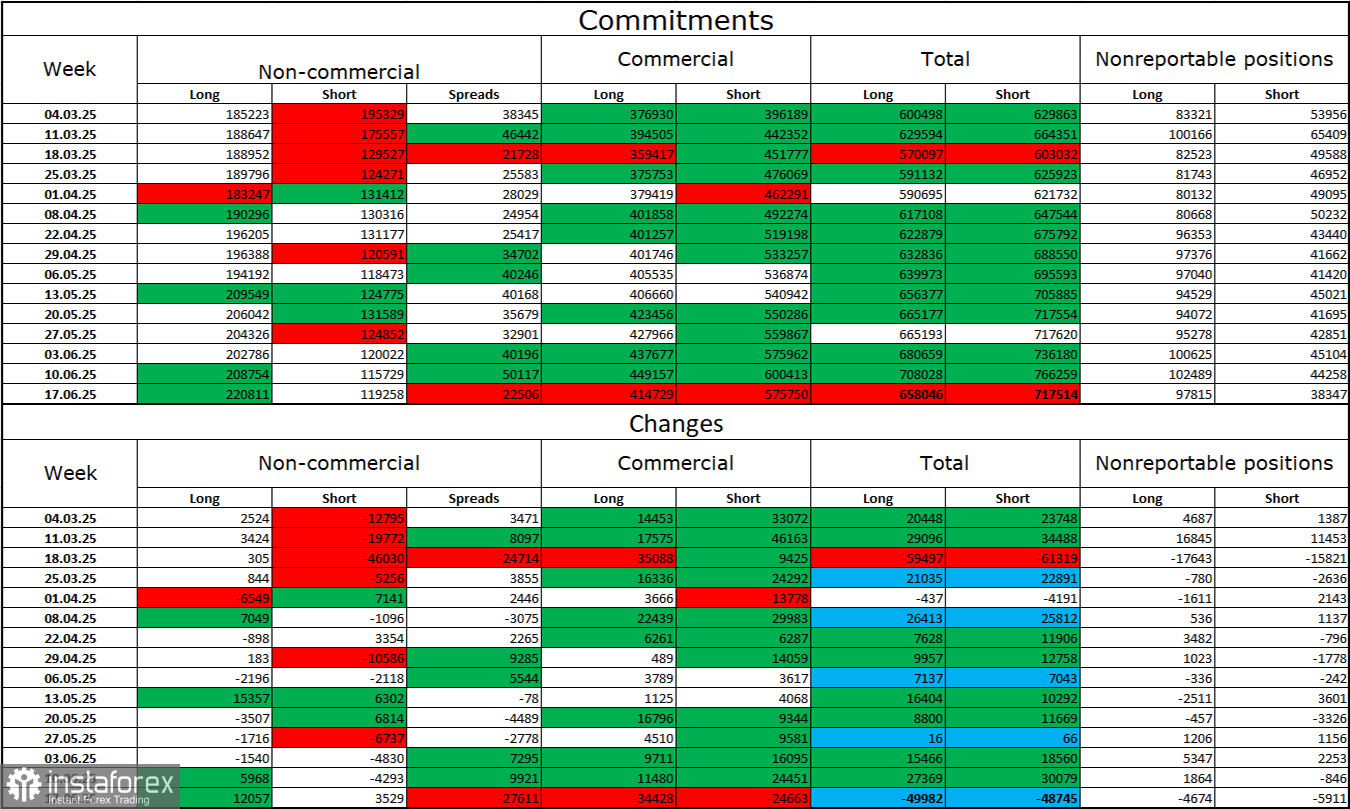
Over the latest reporting week, professional traders opened 12,057 long positions and 3,529 short positions. The "Non-commercial" category remains firmly bullish thanks to Donald Trump and continues to strengthen. Speculators now hold 221,000 long positions versus 119,000 short positions, and the gap continues to widen with few exceptions. This indicates consistent demand for the euro and weak interest in the U.S. dollar.

For twenty consecutive weeks, large traders have been reducing their short positions and increasing their long ones. Although the ECB-Fed policy divergence is already substantial, traders are focusing more on Donald Trump's policies, which may trigger a U.S. recession and create a host of other long-term structural issues for the American economy.

U.S. and EU News Calendar:

  • U.S. – Core PCE Price Index (12:30 UTC)
  • U.S. – Personal Income and Spending (12:30 UTC)
  • U.S. – University of Michigan Consumer Sentiment Index (14:00 UTC)

For June 26, the economic calendar includes three relatively minor events. Therefore, any market impact from the news is likely to be limited and may only appear in the second half of the day.

EUR/USD Forecast and Trading Recommendations:

Selling the pair is possible today upon a rebound from the 1.1712 level on the hourly chart, targeting 1.1645 and 1.1574. I previously recommended buying on a rebound from 1.1454 with a target of 1.1574. That target was reached, and a break above it allowed for further long positions with targets at 1.1645 and 1.1712—all of which have now been met. New buying opportunities may arise upon a close above 1.1712, targeting 1.1802.

The Fibonacci levels are drawn from 1.1574 to 1.1066 on the hourly chart and from 1.1214 to 1.0179 on the 4-hour chart.

Samir Klishi,
Analytical expert of InstaTrade
© 2007-2025

Recommended Stories

EUR/USD – August 14th. Friday will be decisive

On Wednesday, the EUR/USD pair continued its upward movement and consolidated above the 76.4% retracement level at 1.1695. This suggests that the euro may continue rising today toward the next

Samir Klishi 11:57 2025-08-14 UTC+2

GBP/USD – August 14th. The UK economy delivers positive news

On the hourly chart, the GBP/USD pair continued its upward move on Wednesday and reached the 100.0% retracement level at 1.3586, which borders the resistance area of 1.3611–1.3620. A rebound

Samir Klishi 11:15 2025-08-14 UTC+2

EUR/USD. Indicator Analysis on August 14, 2025

On Wednesday, the pair, moving upward, tested the 85.4% retracement level at 1.1731 (yellow dashed line) and then declined, closing the daily candle at 1.1704. Today, the price may begin

Stefan Doll 11:00 2025-08-14 UTC+2

GBP/USD. Indicator Analysis on August 14, 2025

On Wednesday, the pair, moving upward, tested the upper fractal at 1.3587 (red dashed line) and then retreated slightly, closing the daily candle at 1.3571. Today, the price may begin

Stefan Doll 10:48 2025-08-14 UTC+2

EUR/USD. The Pair May Correct Downward Amid Trump's Speech

Today, U.S. President D. Trump is scheduled to speak. Investors, already aware that he might throw in something unexpected, are reducing part of their long positions in the pair just

Pati Gani 10:03 2025-08-14 UTC+2

XAU/USD. Analysis and Forecast

The breakout above the $3358 level, where the 100-period Simple Moving Average (SMA) on the 4-hour chart is located, against the backdrop of the earlier confirmed hold above the 200-period

Irina Yanina 08:38 2025-08-14 UTC+2

There was an attempt to strengthen despite a weakening bias in the commodity asset Palladium against the USD. Thursday, August 14, 2025.

[XPD/USD] – [Thursday, August 14, 2025] Although the bias for Palladium remains weakening, as indicated by the Death Cross of the two EMAs, the RSI (14) which

Arief Makmur 06:21 2025-08-14 UTC+2

Today, the Nasdaq 100 index has the potential to weaken to its nearest support level. Thursday, August 14, 2025.

[Nasdaq 100 Index] – [Thursday, August 14, 2025] Although the EMA (50) is still forming a Golden Cross above the EMA(200), the RSI (14) indicator, which is at a neutral

Arief Makmur 06:21 2025-08-14 UTC+2

EUR/USD Forecast for August 14, 2025

The euro has consolidated above the daily-scale balance indicator line and is slowly continuing its rise toward the MACD line at 1.1770. The Marlin oscillator has entered positive territory

Laurie Bailey 04:57 2025-08-14 UTC+2

GBP/USD Forecast for August 14, 2025

Once again, the British pound has emerged as a leader in the currency market during the rise in stock indexes, showing strong risk appetite. However, we will see the consequences

Laurie Bailey 04:57 2025-08-14 UTC+2
Can't speak right now?
Ask your question in the chat.
 

Dear visitor,

Your IP address shows that you are currently located in the USA. If you are a resident of the United States, you are prohibited from using the services of InstaFintech Group including online trading, online transfers, deposit/withdrawal of funds, etc.

If you think you are seeing this message by mistake and your location is not the US, kindly proceed to the website. Otherwise, you must leave the website in order to comply with government restrictions.

Why does your IP address show your location as the USA?

  • - you are using a VPN provided by a hosting company based in the United States;
  • - your IP does not have proper WHOIS records;
  • - an error occurred in the WHOIS geolocation database.

Please confirm whether you are a US resident or not by clicking the relevant button below. If you choose the wrong option, being a US resident, you will not be able to open an account with InstaTrade anyway.

We are sorry for any inconvenience caused by this message.