See also

 26.06.2025 09:04 AM
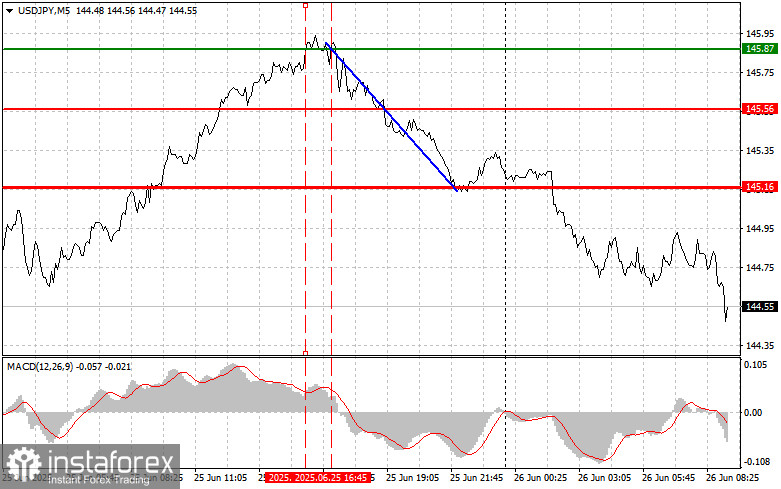
The first test of the 145.87 price level occurred at a moment when the MACD indicator had already risen significantly above the zero line, limiting the dollar's upward potential. The second test of 145.87 shortly afterward coincided with the MACD entering the overbought zone, enabling the execution of Sell Scenario #2, which resulted in a decline of more than 70 pips.
The sharp weakening of the dollar against a range of risk assets also affected the USD/JPY pair. Trump's criticism of Powell had an effect, leading to the closing of long positions on the dollar and increased buying of the Japanese yen. The president's decisive rhetoric against the Chair of the Federal Reserve sowed uncertainty in the currency market. Fearing political interference in the central bank's independence, investors chose to divest from dollar-denominated assets to minimize potential risks. This wave of selling put considerable pressure on the U.S. currency.
The Japanese yen, traditionally viewed as a safe haven during times of turbulence, became the main beneficiary of this situation. Its appeal as a protective asset has increased amid political instability and economic uncertainties. The closing of long dollar positions and rising demand for the yen reflect a shift in market sentiment. Investors who had previously bet on dollar strength are reassessing their positions in response to political risks and concerns over the Fed's future monetary policy. This trend may continue if the rhetoric toward the Fed remains aggressive, further pressuring the dollar and supporting demand for safe-haven assets like the yen.
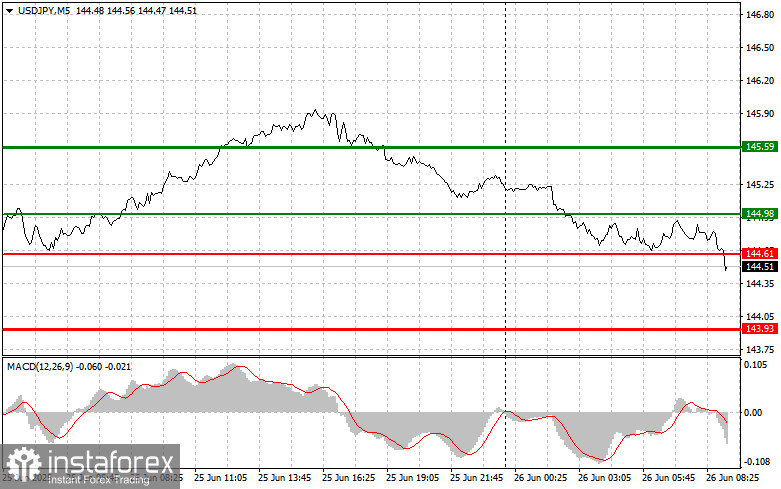
For intraday strategy, I will focus primarily on implementing Scenarios #1 and #2.
Scenario #1: I plan to buy USD/JPY today at the entry point around 144.98 (green line on the chart), targeting a rise to 145.59 (thicker green line on the chart). Around 145.59, I plan to exit long positions and open shorts in the opposite direction (expecting a 30–35 pip reversal). It's best to return to buying this pair during corrections and significant pullbacks in USD/JPY.
Important! Before buying, ensure the MACD indicator is above the zero line and beginning to rise.
Scenario #2: I also plan to buy USD/JPY today in the event of two consecutive tests of the 144.61 level when the MACD is in the oversold zone. This will limit the pair's downside potential and trigger an upward reversal. A rise toward the opposite levels of 144.98 and 145.59 can be expected.
Scenario #1: I plan to sell USD/JPY today only after breaking below the 144.61 level (red line on the chart), which may lead to a quick decline in the pair. The key target for sellers will be the 143.93 level, where I plan to exit short positions and immediately open long positions in the opposite direction (expecting a 20–25 pip move upward). Selling pressure on the pair could quickly return today.
Important! Before selling, make sure the MACD indicator is below the zero line and beginning to decline.
Scenario #2: I also plan to sell USD/JPY today in the event of two consecutive tests of the 144.98 level when the MACD is in the overbought zone. This will limit the pair's upward potential and lead to a reversal downward. A decline toward the opposite levels of 144.61 and 143.93 can be expected.