See also

 16.06.2025 05:05 PM
The US stock market stands at a crossroads. It has shown strength by recovering from panic sell-offs but has yet to deliver a clear signal for a sustained trend. The coming days are more than just a series of numbers and reports — they're a test of resilience.
If the market holds its ground, there's a chance for June to close on a positive note. If not, the current range may prove to be a peak before a deeper decline.
The fundamental picture
Geopolitical risks have escalated to the point where headlines are now moving indices more than any economic report. The Middle East conflict between Israel and Iran has entered an active phase: following a series of attacks on nuclear and energy facilities in both countries, the world is now witnessing the beginning of open warfare.
Tehran's threats to block the Strait of Hormuz immediately impacted oil prices, adding more turbulence to a market already pressured by monetary policy uncertainty.
Stock indices reacted predictably: on Friday, the Dow dropped 1.79%, the S&P 500 lost 1.13%, and the Nasdaq fell 1.3%. The sell-off would have been deeper if not for buyers stepping in during the overnight session, recouping significant losses.
This is a signal: despite the pressure, there is still confidence in the market's fundamentals. However, confidence is fragile. Right now, it's built less on economic data and more on hope that geopolitics won't blow up the market from within.
Meanwhile, the Federal Reserve remains under pressure. Trump is intensifying rhetoric in favor of easing policy, but the central bank continues to maintain a wait-and-see stance. At the upcoming meeting, rates are expected to remain unchanged, despite risks of an economic slowdown and rising energy costs tied to the conflict.
For investors, this means one thing: until the Fed provides a clear policy signal, the market remains hostage to headlines and emotions.
Technical analysis
The S&P 500 is displaying a textbook range-trading pattern, which isn't bad under current conditions. The latest session's low was 5,927, with a high at 6,054. The June range spans 160 points, and key levels are now clearly defined: support at 5,930/5,910 and resistance at 6,050/6,075.
Continued movement within this range will be seen as consolidation, but a breakout in either direction will provide the next reference point.
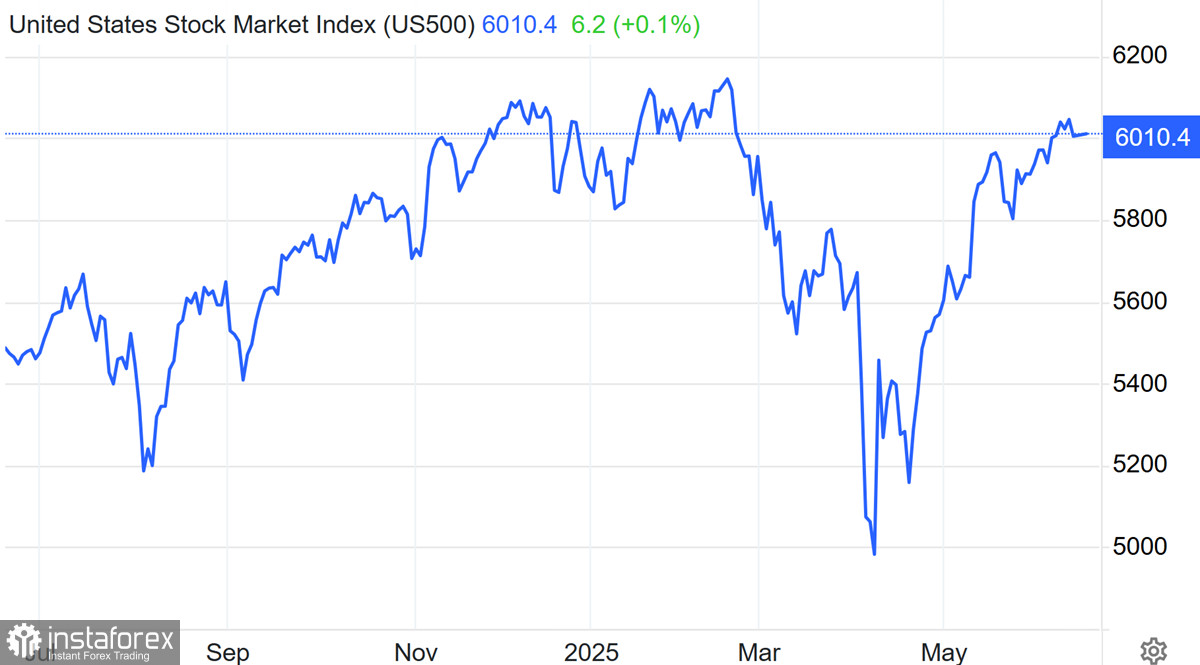
We've already seen a test of 5,927, followed by a rebound — a sign that buying interest persists near support. On the recovery, the index broke through 5,995/6,005, shifting focus to the next resistance zones at 6,025/6,030 and then 6,055/6,060.
These levels aren't just numbers on the chart; they intersect with the weekly trendline, and a breakout could trigger upward momentum. However, as long as trading remains inside the established range, the market gives no clear directional signal.
A breakout above 6,075 with volume confirmation would open the path toward 6,100+. Conversely, if support around 5,910/5,895 fails, the market could slip to 5,875 and lower, forcing a reassessment of the entire scenario.
The Nasdaq 100 acted more aggressively, testing the 21,471 zone before rebounding sharply to 21,915. This was a classic case where short positions near 21,700/21,800 delivered expected returns. Yet, the market showed strength: the quick recovery brings the focus back to a possible breakout to the upside.
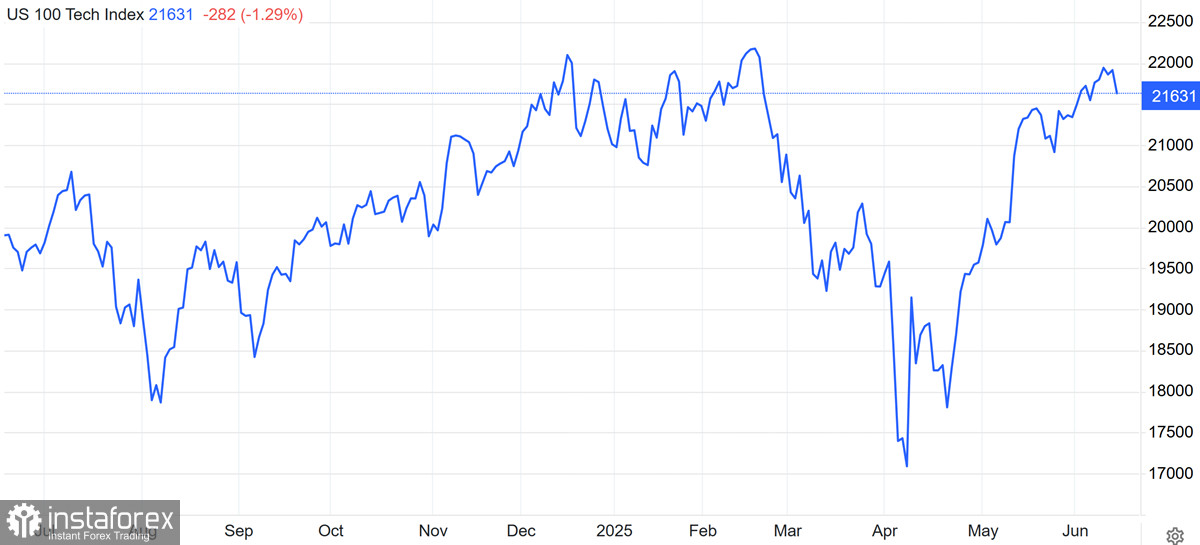
Key support lies at 21,400/21,300 — potential entry zones for long positions on the next pullback. Resistance is at 21,900. A confirmed breakout here targets 21,970/21,990, with a possible retest of 22,050/22,106. Technically, the Nasdaq is on the verge of transitioning from correction to recovery.
Where the stock heads: pending events and scenarios
The upcoming week will be packed with major events: geopolitics, macro data, oil reports, and corporate reports are all intertwined. The first key test will be the Producer Price Index (PPI) report.
After the unexpectedly soft CPI figure, investors are hoping for a similar trend in PPI. A soft PPI would reinforce expectations that the Fed can hold off on further tightening. A strong PPI, however, could trigger profit-taking.
The second key factor remains geopolitics. If the US–China trade agreement is officially confirmed, it may give the bulls new fuel. But if Middle East tensions escalate further, any rally may prove short-lived.
The market will react sharply to any threats against oil supplies and energy infrastructure.
The season of corporate reports also continues. Oracle has already reported strong results, and if Chewy, Adobe, and others follow suit, the Nasdaq may attempt a breakout above 22,000.
Base scenario: The market continues to hover near the upper end of the range. The S&P 500 holds above 5,950; the Nasdaq holds above 21,400. If PPI data is neutral and no new Middle East escalations occur, a breakout toward 6,100 on the S&P and 22,100+ on the Nasdaq becomes possible, signaling the end of the corrective phase and a return to trend.
Alternative scenario: If the PPI surprises to the upside and geopolitical news worsens, the market may quickly retreat toward 5895 (S&P) and 21,300 (Nasdaq), where buyers are likely to step in once again.


