empty
06.06.2025 03:38 PM
GBP/USD: Trading Plan for the U.S. Session on June 6th (Review of Morning Trades)

In my morning forecast, I highlighted the 1.3544 level and planned to make market entry decisions based on it. Let's look at the 5-minute chart and see what happened. A decline toward 1.3544 occurred, followed by a false breakout, providing a buying opportunity for the pound, but no significant growth materialized. The technical picture was not revised for the second half of the day.

This image is no longer relevant

Requirements for Opening Long Positions on GBP/USD:

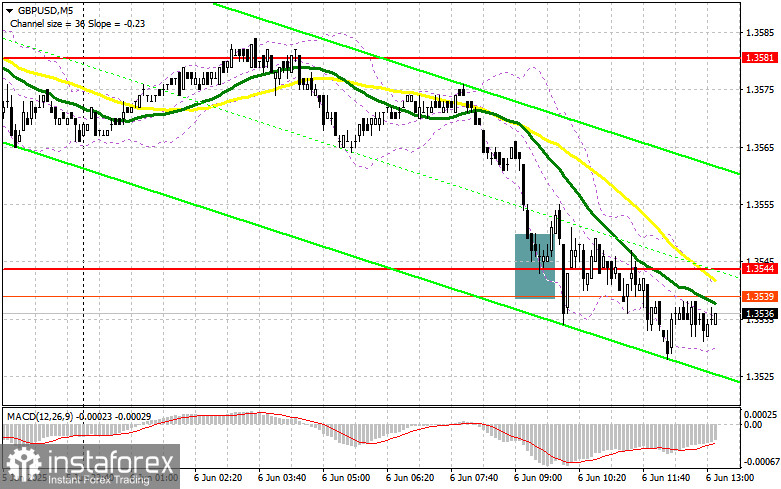
Now everything depends on the U.S. labor market data. Strong nonfarm payroll growth above economists' forecasts would be a reason to continue selling the pound and buying the dollar. Otherwise, the pair may see a strong upward movement. In case of strong data, I prefer to act around the 1.3544 support, where trading is currently taking place. A false breakout there, similar to the earlier scenario, would be a good signal to buy GBP/USD, aiming for a return to the 1.3581 resistance. A breakout and retest of this range from above would create a new entry point for long positions, extending the bullish market with a target of 1.3613. The ultimate target would be the 1.3659 area, where I would take profit.

If GBP/USD declines and bulls show no activity around 1.3544, pressure on the pound could significantly increase. In that case, only a false breakout around 1.3502 would provide a suitable condition for opening long positions. Alternatively, I plan to buy GBP/USD on a rebound from the 1.3473 support, targeting an intraday correction of 30–35 points.

Requirements for Opening Short Positions on GBP/USD:

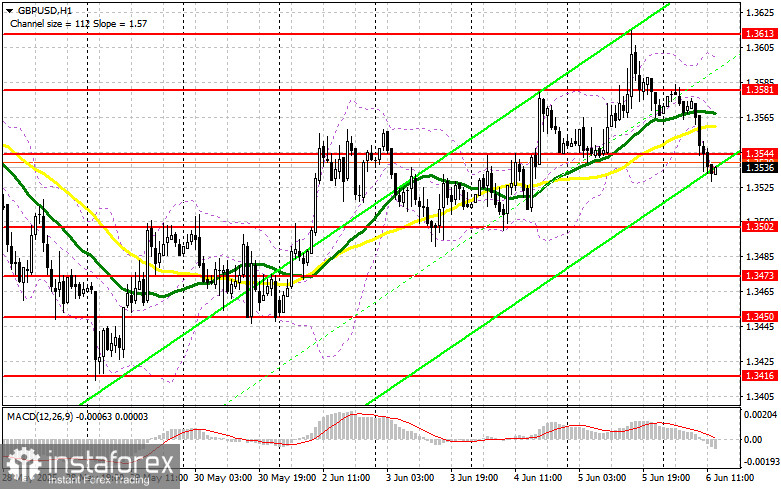
Sellers made an attempt, but the market remains on the buyers' side, and only very strong U.S. labor market data — which is unlikely — could limit the pair's upward potential. If GBP/USD spikes upward after the data release, I plan to act after a false breakout around the 1.3581 resistance. This would be sufficient for an entry point to sell, targeting a decline to the 1.3544 support. A breakout and retest from below would trigger stop-loss orders and open the path to 1.3502. The ultimate target would be the 1.3473 area, where I plan to take profit.

If demand for the pound persists in the second half of the day and bears do not show up at 1.3581, it's better to postpone selling until the 1.3613 resistance is tested. I will open short positions there only after a failed breakout. If there's no downward movement even there, I'll look for short opportunities around 1.3659, but only for an intraday correction of 30–35 points.

This image is no longer relevant

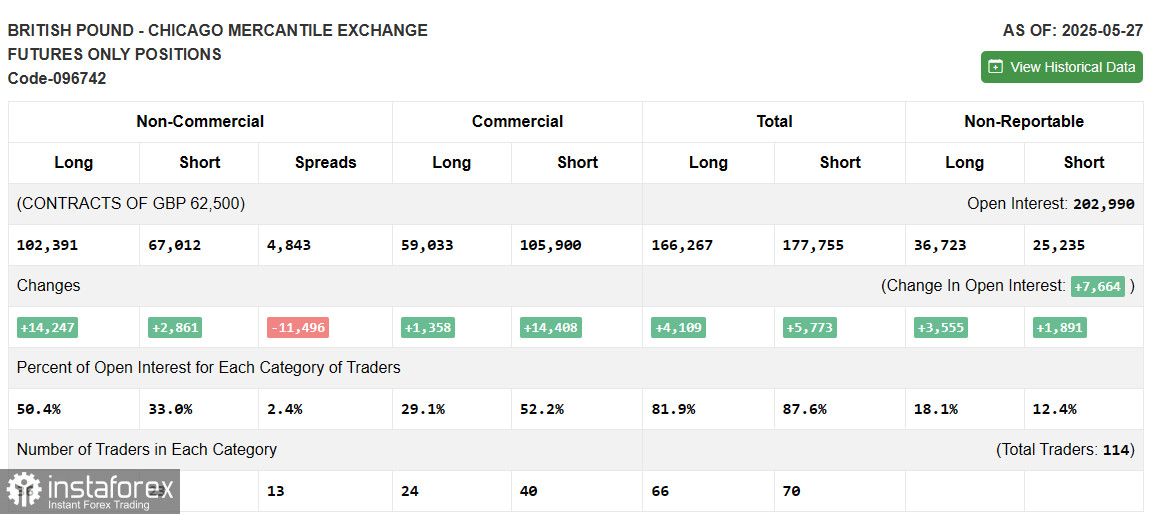
The COT (Commitment of Traders) report dated May 27 showed a sharp increase in long positions and a less active increase in short positions. Following the trade agreement between the U.K. and the U.S., demand for the pound continues to persist. Considering the Bank of England remains on the sidelines and refrains from monetary intervention, there are fairly good chances for further strengthening of the pound. Add to that the ongoing trade disputes between China and the U.S. and the weakness of the U.S. dollar, and it becomes clear that the medium-term bullish trend for the pound is not yet over. No significant U.K. statistics are expected soon, so there are fewer reasons for large players to sell the pound than to buy it. The latest COT report indicates that long non-commercial positions rose by 14,247 to 102,391, while short non-commercial positions rose by 2,861 to 67,012. As a result, the gap between long and short positions narrowed by 11,469.

This image is no longer relevant

Indicator Signals:

Moving Averages

Trading is occurring below the 30- and 50-period moving averages, indicating a potential decline in the pair.

Note: The period and prices of the moving averages considered are on the H1 hourly chart and differ from the classic daily moving averages on the D1 chart.

Bollinger Bands

In case of a decline, the lower boundary around 1.3544 will act as support.

Indicator Descriptions:

  • Moving Average (determines the current trend by smoothing volatility and noise), Period – 50, marked in yellow on the chart;
  • Moving Average, Period – 30, marked in green on the chart;
  • MACD Indicator (Moving Average Convergence/Divergence) – Fast EMA: 12-period, Slow EMA: 26-period, SMA: 9-period;
  • Bollinger Bands, Period – 20;
  • Non-commercial traders – Speculators such as individual traders, hedge funds, and large institutions using the futures market for speculative purposes and meeting certain requirements;
  • Long non-commercial positions represent the total long open positions of non-commercial traders;
  • Short non-commercial positions represent the total short open positions of non-commercial traders;
  • Net non-commercial position is the difference between the short and long positions of non-commercial traders.
Miroslaw Bawulski,
Analytical expert of InstaTrade
© 2007-2025

Recommended Stories

GBP/USD: Trading Plan for the U.S. Session on July 7th (Review of Morning Trades)

In my morning forecast, I highlighted the 1.3602 level and planned to use it to determine entry points into the market. Let's look at the 5-minute chart and analyze what

Miroslaw Bawulski 13:21 2025-07-07 UTC+2

EUR/USD: Trading Plan for the U.S. Session on July 7th (Review of the Morning Trades)

In my morning forecast, I highlighted the 1.1749 level and planned to base market entry decisions around it. Let's look at the 5-minute chart and break down what happened

Miroslaw Bawulski 13:20 2025-07-07 UTC+2

How to Trade the GBP/USD Currency Pair on July 7th? Simple Tips and Trade Review for Beginners

On Friday, the GBP/USD pair showed total flat movement and low volatility. As with the EUR/USD pair, there was no news that day, and no macroeconomic publications were released either

Paolo Greco 07:48 2025-07-07 UTC+2

How to Trade the EUR/USD Currency Pair on July 7th: Simple Tips and Trade Analysis for Beginners

Friday Trade Analysis: EUR/USD 1H Chart The EUR/USD pair stayed flat all day Friday, with volatility totaling 36 points, clearly indicating a lack of trading activity. This is not surprising

Paolo Greco 07:32 2025-07-07 UTC+2

GBP/USD Trading Recommendations and Trade Analysis for July 7th

The GBP/USD currency pair traded with low volatility and primarily moved sideways. As mentioned earlier, last week was particularly interesting in how the market interpreted various events and publications

Paolo Greco 07:11 2025-07-07 UTC+2

EUR/USD Trading Recommendations and Trade Analysis for July 7th

The EUR/USD currency pair did not exhibit any notable movements on Friday—or any movements at all. Friday was Independence Day in the United States, effectively making it a non-trading

Paolo Greco 07:03 2025-07-07 UTC+2

GBP/USD: Trading Plan for the U.S. Session on July 4th (Review of Morning Trades)

In my morning forecast, I highlighted the 1.3672 level as a key decision point for entering the market. Let's look at the 5-minute chart and analyze what happened. A rise

Miroslaw Bawulski 18:20 2025-07-04 UTC+2

EUR/USD: Trading Plan for the U.S. Session on July 4th (Review of Morning Trades)

In my morning forecast, I highlighted the 1.1787 level as a key point for making trading decisions. Let's look at the 5-minute chart to analyze what happened. A rise

Miroslaw Bawulski 18:16 2025-07-04 UTC+2

How to Trade the GBP/USD Pair on July 4? Simple Tips and Trade Analysis for Beginners

Analysis of Thursday's Trades 1H Chart of GBP/USD On Thursday, the GBP/USD pair once again plummeted, but this time the drop in the British currency lasted only five minutes

Paolo Greco 07:16 2025-07-04 UTC+2

How to Trade the EUR/USD Pair on July 4? Simple Tips and Trade Analysis for Beginners

Analysis of Thursday's Trades 1H Chart of EUR/USD The EUR/USD currency pair traded throughout Thursday, both before and after the publication of the U.S. Nonfarm Payrolls and unemployment data

Paolo Greco 06:34 2025-07-04 UTC+2
Can't speak right now?
Ask your question in the chat.