empty
06.06.2025 08:13 AM
Forecast for USD/JPY on June 6, 2025

As of this morning, the USD/JPY pair has found itself in a completely dual situation, with an equal likelihood of both growth and decline. Indicators suggesting growth include the price holding above the 143.45 level, the inability of the price to fall below the MACD line, and the current candlestick resting exactly on the Fibonacci time line with a growing upward intention. The Marlin oscillator is testing the boundary of the growth territory, where the probability of an upward breakout slightly exceeds the likelihood of a downward reversal.

This image is no longer relevant

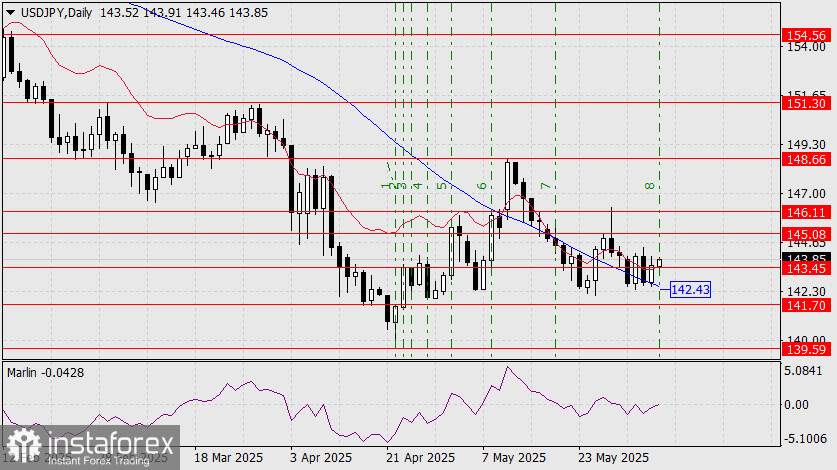
However, even if today's candlestick turns out to be black, by Monday a new candlestick must consolidate below the MACD line (142.43); otherwise, this bearish push will also prove to be short-lived. The target for growth is 146.11. Under the current circumstances, the 145.08 level appears to be an intermediate target. If today's Nonfarm Payrolls weaken the dollar, the primary downward target will be 139.59, which could be reached within 2–3 days.

This image is no longer relevant

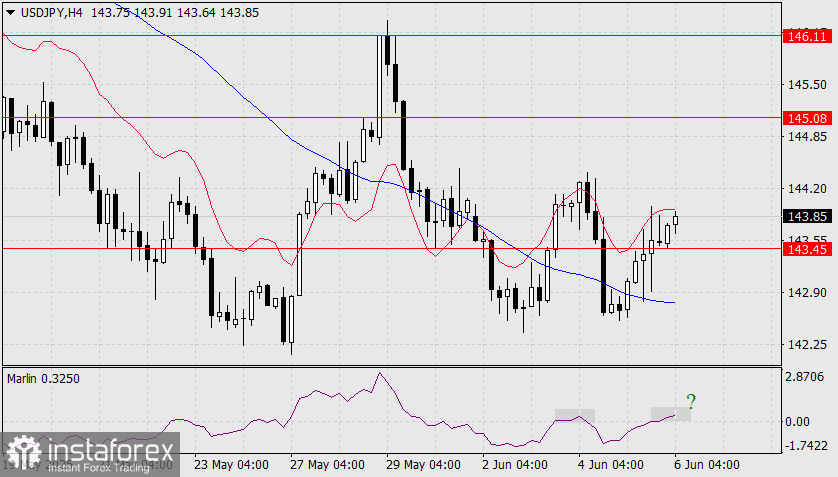
On the four-hour chart, the price is rising above the indicator lines, above the 143.45 level, and the Marlin oscillator has moved into positive territory. However, all these signs of growth could turn out to be false, as happened on June 3–4 (the gray area on the oscillator). We await the release of U.S. labor data.

Laurie Bailey,
Analytical expert of InstaTrade
© 2007-2025

Recommended Stories

USD/JPY. Analysis and Forecast

The USD/JPY pair remains in a consolidation phase near a three-week high, supported by U.S. dollar strength and mixed market signals. The dollar is being bolstered by U.S. President Donald

Irina Yanina 12:17 2025-07-14 UTC+2

Technical Analysis for the Week of July 14–19: GBP/USD Currency Pair

Last week, the pair moved downward and broke below the 8-period EMA at 1.3509 (thin blue line), closing the weekly candle at 1.3487. In the upcoming week, the price

Stefan Doll 11:40 2025-07-14 UTC+2

Technical Analysis for the Week of July 14–19: EUR/USD Currency Pair

Last week, the pair moved downward and nearly tested the 23.6% retracement level at 1.1647 (blue dashed line), after which the price turned upward and closed the weekly candle

Stefan Doll 11:34 2025-07-14 UTC+2

Forecast for EUR/USD on July 14, 2025

On Friday, the EUR/USD pair rebounded from the 127.2% Fibonacci retracement level at 1.1712, reversed in favor of the U.S. dollar, and resumed its decline toward the 1.1645 level

Samir Klishi 11:31 2025-07-14 UTC+2

Forecast for GBP/USD on July 14, 2025

On the hourly chart, the GBP/USD pair on Friday consolidated below the 127.2% Fibonacci level at 1.3527 and continued its decline toward the next retracement level of 100.0% at 1.3444

Samir Klishi 11:25 2025-07-14 UTC+2

Cable still has the potential to continue its decline to its support level on Monday, July 14, 2025.

GBP/USD – Monday, July 14, 2025 GBP/USD is moving in a weakening condition where this is confirmed by its price movement below the 50-EMA, which is also below the 200-EMA

Arief Makmur 07:21 2025-07-14 UTC+2

The USD/CAD commodity currency pair has the potential to correct towards its pivot point today, Monday, July 14, 2025.

USD/CAD, July 14, 2025 Although the Lonnie is moving in a neutral-bullish position, there is potential for the USD/CAD commodity currency pair to test its pivot and support levels today

Arief Makmur 07:21 2025-07-14 UTC+2

EUR/USD Forecast for July 14, 2025

Friday's candlestick for the EUR/USD pair closed bearish, with the price consolidating below the daily MACD line. The objective for today is to secure a close below the 1.1692 level

Laurie Bailey 05:31 2025-07-14 UTC+2

GBP/USD Forecast for July 14, 2025

On Friday, the British pound lost more than 80 pips, breaking below the daily balance line and the key signal level at 1.3510. The decline was driven by weak

Laurie Bailey 05:31 2025-07-14 UTC+2

AUD/USD Forecast for July 14, 2025

On the daily chart, the AUD/USD pair is positioned between the MACD line (0.6551) and the upper boundary of the local price channel (blue, 0.6597). A breakout of either level

Laurie Bailey 05:31 2025-07-14 UTC+2
Can't speak right now?
Ask your question in the chat.
 

Dear visitor,

Your IP address shows that you are currently located in the USA. If you are a resident of the United States, you are prohibited from using the services of InstaFintech Group including online trading, online transfers, deposit/withdrawal of funds, etc.

If you think you are seeing this message by mistake and your location is not the US, kindly proceed to the website. Otherwise, you must leave the website in order to comply with government restrictions.

Why does your IP address show your location as the USA?

  • - you are using a VPN provided by a hosting company based in the United States;
  • - your IP does not have proper WHOIS records;
  • - an error occurred in the WHOIS geolocation database.

Please confirm whether you are a US resident or not by clicking the relevant button below. If you choose the wrong option, being a US resident, you will not be able to open an account with InstaTrade anyway.

We are sorry for any inconvenience caused by this message.