empty
16.05.2025 10:13 AM
Forecast for GBP/USD on May 16, 2025

On the hourly chart, the GBP/USD pair on Thursday reversed once again in favor of the British pound and began a renewed move toward the resistance zone of 1.3344–1.3357. A rebound from this zone will again work in favor of the U.S. dollar and could lead to a renewed decline toward the 100.0% Fibonacci retracement level at 1.3205. A breakout above the 1.3344–1.3357 area would increase the likelihood of continued growth toward the next level at 1.3425.

This image is no longer relevant

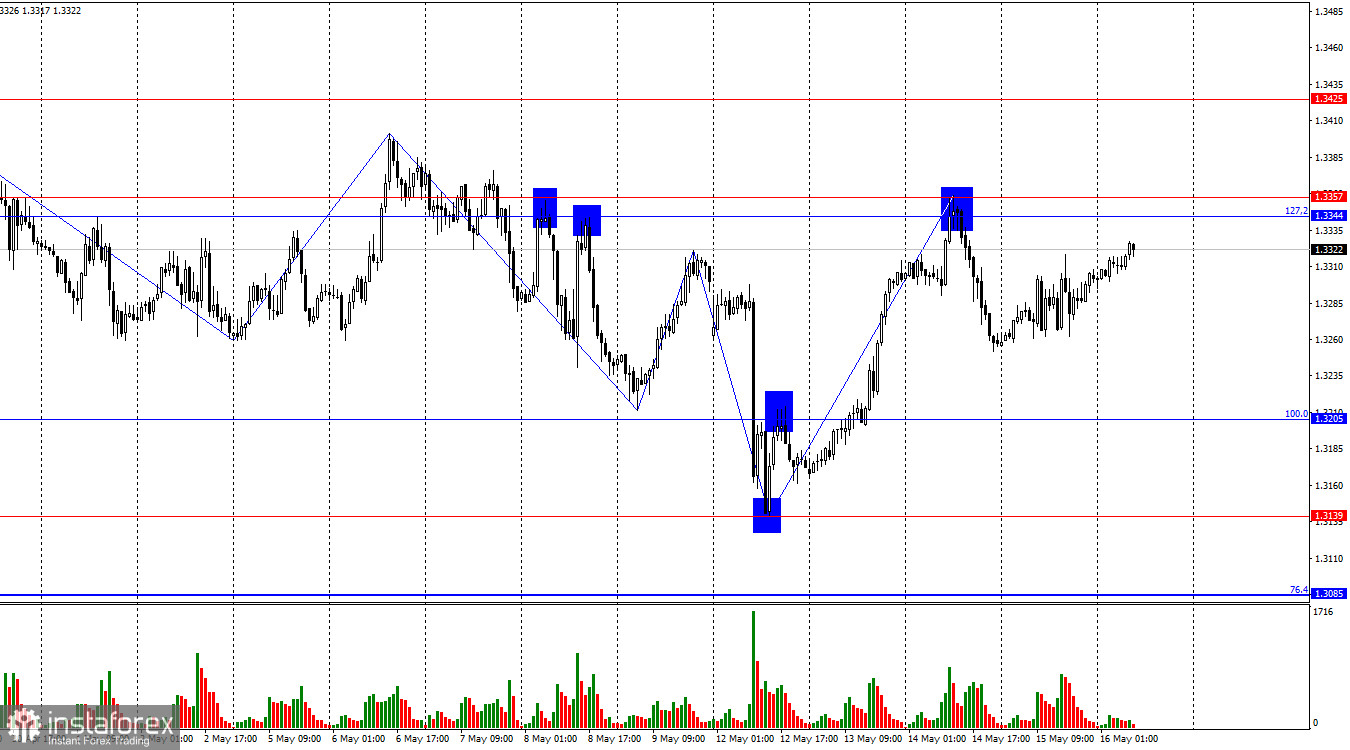
The wave situation became more complex after the latest bullish assault. The last completed upward wave broke through the previous peak, but the most recent downward wave also broke through the previous low. This suggests a potential transition from a bearish to a bullish trend. Bulls may find it difficult to rise above 1.3425 without new trade-related headlines from Donald Trump about new or expanded tariffs—but bears haven't had it easy either, as recent days have shown. In my opinion, the latest upward wave was a fluke; the 1.3344–1.3357 zone will reveal the true strength of the bulls.

The news background on Thursday offered slight support to the bulls. The UK economy grew more than expected, allowing pound bulls to mount a new, albeit weak, attack—dampened by a worse-than-expected industrial production report. From the U.S., the Producer Price Index fell sharply by 0.5% m/m in April. However, we already know that CPI also decreased—from 2.4% y/y to 2.3%. This brings the Fed closer to a tipping point where it will become increasingly difficult to resist market pressure. The market is calling for a rate cut, Donald Trump is demanding monetary easing, and only Jerome Powell remains defiant, expecting inflation to rise again. Yet Powell won't be able to hold his ground indefinitely without supportive data. Therefore, bears are urgently in need of good news—such as tariff reductions, signed trade deals, or any other positive headlines. Otherwise, bulls could regain the upper hand on expectations of policy easing.

This image is no longer relevant

On the 4-hour chart, the pair rebounded from the 100.0% Fibonacci level at 1.3435, reversed in favor of the U.S. dollar, and continues to decline toward the 76.4% retracement level at 1.3118. No forming divergences are observed on any indicators today. The upward trend channel still points to a bullish trend. Only a confirmed break below the channel would signal a prolonged bearish trend.

This image is no longer relevant

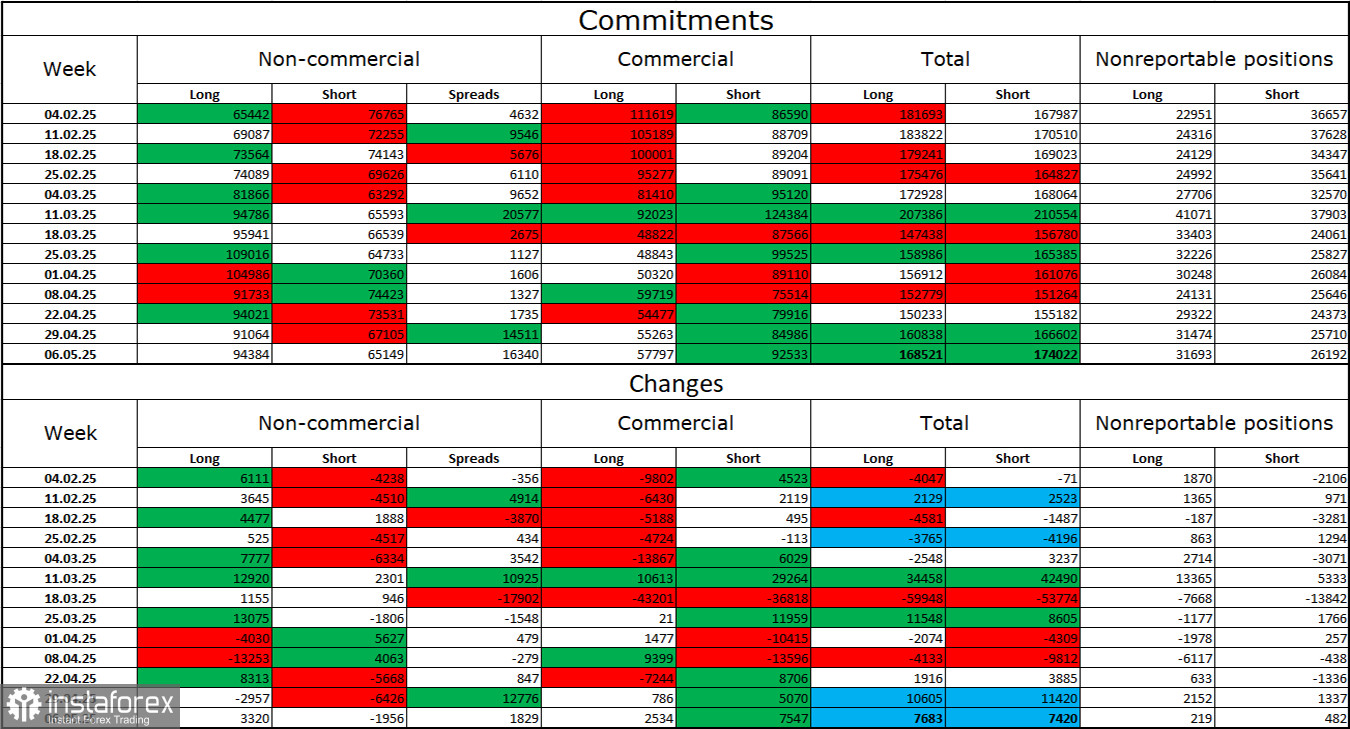
The sentiment among the "Non-commercial" trader category became more bullish over the last reporting week. The number of long positions held by speculators rose by 3,320, while short positions declined by 1,956. Bears lost their advantage. The gap between long and short positions now stands at 29,000 in favor of bulls: 94K vs. 65K.

In my view, the pound still faces downside risks, but recent developments could prompt a long-term trend reversal. Over the past three months, the number of long positions has risen from 65K to 94K, and short positions have fallen from 76K to 65K. Under Donald Trump, faith in the U.S. dollar has eroded, and COT data show that traders lack a strong appetite for dollar-buying.

News Calendar: U.S. and U.K.

  • U.S. – Building Permits (12:30 UTC)
  • U.S. – Housing Starts (12:30 UTC)
  • U.S. – University of Michigan Consumer Sentiment Index (14:00 UTC)

On Friday, the economic calendar includes several entries, but none are particularly significant. Market sentiment may be only mildly affected by the data releases.

GBP/USD Forecast and Trading Tips:

Selling the pair was possible on a rebound from the 1.3344–1.3357 zone on the hourly chart with targets at 1.3265 and 1.3205. Today, selling is again possible from this resistance zone. Buying may be considered on a confirmed breakout above 1.3344–1.3357 with a target at 1.3425.

Fibonacci levels:

  • Hourly chart: based on 1.3205 – 1.2695
  • 4-hour chart: based on 1.3431 – 1.2104
Samir Klishi,
Analytical expert of InstaTrade
© 2007-2025

Recommended Stories

XAU/USD remains under pressure, although there is limited potential for strengthening. Wednesday, August 13, 2025.

[XAU/USD] – [Wednesday, August 13, 2025] XAU/USD appears to be attempting to test its nearest support level, as confirmed by the RSI (14) indicator, which is in the Neutral-Bearish area

Arief Makmur 08:25 2025-08-13 UTC+2

Despite the potential for a downward correction, the AUD/USD remains in strengthen bias condition. Wednesday, August 13, 2025.

[AUD/USD] – [Wednesday, August 13, 2025] With the AUD/USD position which have EMA(50) still above the EMA(200) level and the RSI (140) in the neutral-bullish zone, the bias for this

Arief Makmur 08:25 2025-08-13 UTC+2

EUR/USD forecast for August 13, 2025

Yesterday, the euro once again attempted to test the balance line resistance. This time, it was supported by external markets — the S&P 500 rose by 1.14% and even

Laurie Bailey 05:00 2025-08-13 UTC+2

GBP/USD forecast for August 13, 2025

Yesterday, the British pound took full advantage of the temporary weakness in the dollar, reaching the second intermediate level of 1.3525. The Marlin oscillator is rising in the territory

Laurie Bailey 05:00 2025-08-13 UTC+2

Silver forecast for August 13, 2025

Yesterday, silver gained 0.41%. The price has returned above the balance indicator line, and the Marlin oscillator, which is close to moving into the territory of an upward trend

Laurie Bailey 04:59 2025-08-13 UTC+2

Trading Signals for GOLD (XAU/USD) for August 12-15, 2025: buy above $3,341 or sell below $3,335 (21 SMA - 200 EMA)

If gold falls below 3,340, the outlook could be negative. It could then resume its downward movement, and we could expect the instrument to reach 5/8 Murray at 3,320

Dimitrios Zappas 13:34 2025-08-12 UTC+2

Trading Signals for EUR/USD for August 12-15, 2025: sell below 1.1647 (200 EMA - 7/8 Murray)

The euro is trading around 1.1618, above the 200 EMA and above the 6/8 Murray, recovering some of the previous day's losses but showing signs of exhaustion. If the euro

Dimitrios Zappas 13:34 2025-08-12 UTC+2

XAU/USD. Analysis and Forecast

From a technical standpoint, gold is managing to hold above the 200-period Simple Moving Average (SMA) on the 4-hour chart, which serves as a key support level. Given that oscillators

Irina Yanina 12:57 2025-08-12 UTC+2

Forecast for EUR/USD on August 12, 2025

On Monday, the EUR/USD pair declined to the 50.0% retracement level at 1.1590 and rebounded from it. As a result, a reversal in favor of the euro was completed

Samir Klishi 11:46 2025-08-12 UTC+2

Forecast for GBP/USD on August 12, 2025

On the hourly chart, GBP/USD on Monday declined to the support area of 1.3416–1.3425 and reversed near it in favor of the pound. This resumed the upward movement toward

Samir Klishi 11:23 2025-08-12 UTC+2
Can't speak right now?
Ask your question in the chat.
 

Dear visitor,

Your IP address shows that you are currently located in the USA. If you are a resident of the United States, you are prohibited from using the services of InstaFintech Group including online trading, online transfers, deposit/withdrawal of funds, etc.

If you think you are seeing this message by mistake and your location is not the US, kindly proceed to the website. Otherwise, you must leave the website in order to comply with government restrictions.

Why does your IP address show your location as the USA?

  • - you are using a VPN provided by a hosting company based in the United States;
  • - your IP does not have proper WHOIS records;
  • - an error occurred in the WHOIS geolocation database.

Please confirm whether you are a US resident or not by clicking the relevant button below. If you choose the wrong option, being a US resident, you will not be able to open an account with InstaTrade anyway.

We are sorry for any inconvenience caused by this message.