empty
16.05.2025 05:21 AM
GBP/USD Forecast for May 16, 2025

On Thursday, the UK released strong GDP data but failed to spark noticeable activity in the currency market, as the growth came solely from the services sector. In Q1, GDP rose 0.7% and increased by 0.2% in March. However, industrial production experienced a contraction of 0.7% in March. This was also reflected in the trade balance, which posted a larger-than-expected deficit of -£19.87 billion versus the forecast of -£19.10 billion. The pound rose by 45 pips, mainly due to a 0.14% decline in the US Dollar Index.

This image is no longer relevant

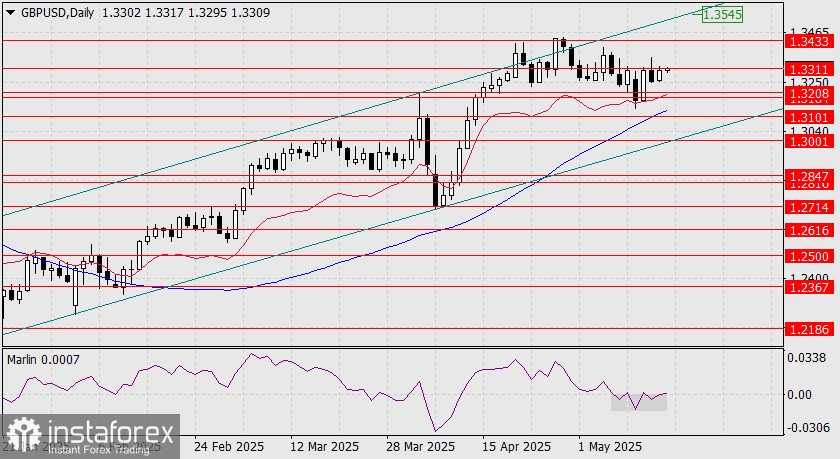
The pound could have risen further, but it encountered technical resistance at 1.3311, which it had already attempted to break during the Asian session. The "Head and Shoulders" pattern on the Marlin oscillator has now fully formed. The oscillator's signal line has moved into positive territory. We expect the oscillator and the price to continue rising toward the nearest target at 1.3433. After that, the next objective will be 1.3545, the upper boundary of the price channel.

This image is no longer relevant

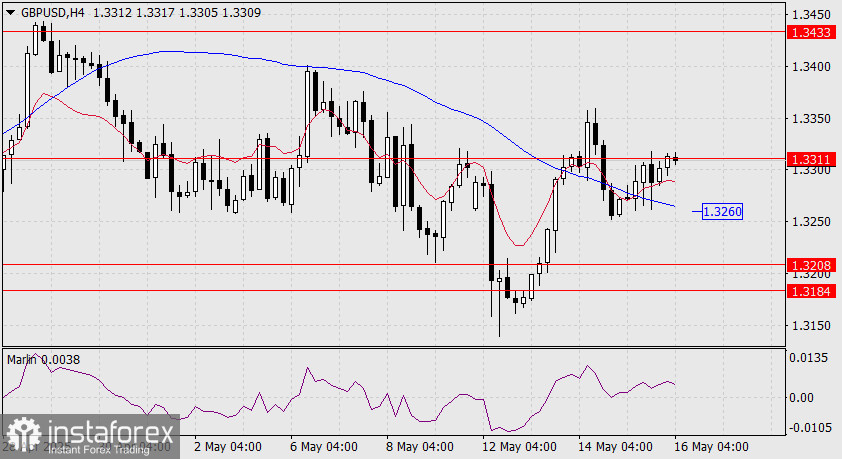
On the four-hour chart, the price rises above the balance and MACD lines, and the current candle has opened above the 1.3311 level. The Marlin oscillator rises in the positive zone, indicating an upward trend.

This trend could be broken, and the price could return to the support zone of 1.3184–1.3208—only if it consolidates below the MACD line around the 1.3260 level.

Laurie Bailey,
Analytical expert of InstaTrade
© 2007-2025

Recommended Stories

USD/JPY. Analysis and Forecast

The USD/JPY pair remains in a consolidation phase near a three-week high, supported by U.S. dollar strength and mixed market signals. The dollar is being bolstered by U.S. President Donald

Irina Yanina 12:17 2025-07-14 UTC+2

Technical Analysis for the Week of July 14–19: GBP/USD Currency Pair

Last week, the pair moved downward and broke below the 8-period EMA at 1.3509 (thin blue line), closing the weekly candle at 1.3487. In the upcoming week, the price

Stefan Doll 11:40 2025-07-14 UTC+2

Technical Analysis for the Week of July 14–19: EUR/USD Currency Pair

Last week, the pair moved downward and nearly tested the 23.6% retracement level at 1.1647 (blue dashed line), after which the price turned upward and closed the weekly candle

Stefan Doll 11:34 2025-07-14 UTC+2

Forecast for EUR/USD on July 14, 2025

On Friday, the EUR/USD pair rebounded from the 127.2% Fibonacci retracement level at 1.1712, reversed in favor of the U.S. dollar, and resumed its decline toward the 1.1645 level

Samir Klishi 11:31 2025-07-14 UTC+2

Forecast for GBP/USD on July 14, 2025

On the hourly chart, the GBP/USD pair on Friday consolidated below the 127.2% Fibonacci level at 1.3527 and continued its decline toward the next retracement level of 100.0% at 1.3444

Samir Klishi 11:25 2025-07-14 UTC+2

Cable still has the potential to continue its decline to its support level on Monday, July 14, 2025.

GBP/USD – Monday, July 14, 2025 GBP/USD is moving in a weakening condition where this is confirmed by its price movement below the 50-EMA, which is also below the 200-EMA

Arief Makmur 07:21 2025-07-14 UTC+2

The USD/CAD commodity currency pair has the potential to correct towards its pivot point today, Monday, July 14, 2025.

USD/CAD, July 14, 2025 Although the Lonnie is moving in a neutral-bullish position, there is potential for the USD/CAD commodity currency pair to test its pivot and support levels today

Arief Makmur 07:21 2025-07-14 UTC+2

EUR/USD Forecast for July 14, 2025

Friday's candlestick for the EUR/USD pair closed bearish, with the price consolidating below the daily MACD line. The objective for today is to secure a close below the 1.1692 level

Laurie Bailey 05:31 2025-07-14 UTC+2

GBP/USD Forecast for July 14, 2025

On Friday, the British pound lost more than 80 pips, breaking below the daily balance line and the key signal level at 1.3510. The decline was driven by weak

Laurie Bailey 05:31 2025-07-14 UTC+2

AUD/USD Forecast for July 14, 2025

On the daily chart, the AUD/USD pair is positioned between the MACD line (0.6551) and the upper boundary of the local price channel (blue, 0.6597). A breakout of either level

Laurie Bailey 05:31 2025-07-14 UTC+2
Can't speak right now?
Ask your question in the chat.
 

Dear visitor,

Your IP address shows that you are currently located in the USA. If you are a resident of the United States, you are prohibited from using the services of InstaFintech Group including online trading, online transfers, deposit/withdrawal of funds, etc.

If you think you are seeing this message by mistake and your location is not the US, kindly proceed to the website. Otherwise, you must leave the website in order to comply with government restrictions.

Why does your IP address show your location as the USA?

  • - you are using a VPN provided by a hosting company based in the United States;
  • - your IP does not have proper WHOIS records;
  • - an error occurred in the WHOIS geolocation database.

Please confirm whether you are a US resident or not by clicking the relevant button below. If you choose the wrong option, being a US resident, you will not be able to open an account with InstaTrade anyway.

We are sorry for any inconvenience caused by this message.