See also

 15.05.2025 12:59 PM
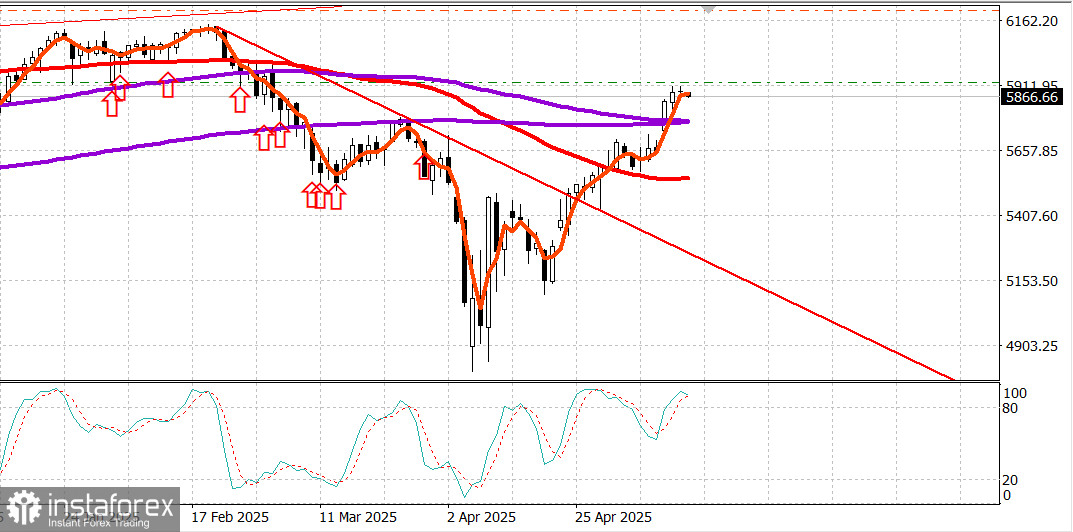
S&P 500
Overview for May 15
US Market: stalling below yearly highs
Performance of the key US indices on Wednesday:
Dow -0.2% | NASDAQ +0.7% | S&P 500 +0.1%
S&P 500: 5,892 | Range: 5,400–6,200
The stock market closed mixed.
The Dow Jones Industrial Average ended slightly lower, the Nasdaq Composite rose 0.7%, and the S&P 500 closed nearly unchanged. Nasdaq's outperformance was driven by continued buying of mega-cap stocks, chipmakers and growth equities.
NVIDIA (NVDA) gained 4.2% to rise to$135.34, leading the winners. Vanguard Mega Cap Growth ETF (MGK) rose 0.8%. PHLX Semiconductor Index (SOX) added 0.6%. Russell 3000 Growth Index closed up 0.6%
However, enthusiasm faded across the broader market. The equal-weighted version of the S&P 500 actually declined by 0.6%, suggesting that investors remained cautious amid concerns that equities are overbought in the short term.
Market participants also paid close attention to US Treasury yields. The 10-year yield rose by three basis points to 4.53%, and the 2-year yield matched the move, climbing to 4.05%. This rise in yields added pressure to equity prices, especially outside the tech sector.
Some stocks experienced sharp individual moves. Super Micro Computer rallied by 15.7% following news of a $20 billion partnership with Saudi Arabia's DataVolt to scale GPU platform deliveries.
In contrast, American Eagle Outfitters tumbled by 6.5% after the company pulled its financial outlook due to economic uncertainty.
Boeing was a standout gainer within the Dow, rising 0.6% after Qatar Airways placed a record-setting order of up to 210 wide-body jets.
From the start of the year through May 15, the S&P 500 is up just 0.2%, while the Dow has declined by 1.2%, and the Nasdaq is down 0.9%. Mid- and small-cap indices are under even more pressure, with the S&P Midcap 400 down 2.3% and the Russell 2000 off by 6.6%.
As for economic data, weekly mortgage applications fell sharply from the previous week's 11% jump, rising only 1.1%.
Weekly EIA crude oil inventories showed an increase of 3.45 million barrels, compared to a decline of 1.11 million barrels last week.
On Thursday, market participants will receive the following economic data: 8:30 ET: April Producer Price Index (PPI) (consensus 0.3%; previous -0.4%). Core Producer Price Index (PPI) (consensus 0.3%; previous -0.1%).April retail sales (consensus 0.2%; previous 1.4%).Retail sales excluding autos (consensus 0.5%; previous 0.5%). May Empire State Manufacturing Index (consensus 1.0; previous -8.1). May Philadelphia Fed Index (consensus -6.0; previous -26.4).Weekly initial jobless claims (consensus 226,000; previous 228,000) and continuing claims (previous 1.879 million).
9:15 ET: April industrial production (consensus 0.3%; previous -0.3%) and capacity utilization (consensus 77.9%; previous 77.8%).
10:00 ET: May business inventories (consensus 0.2%; previous 0.2%) and May NAHB housing market index (consensus 40; previous 40).
10:30 ET: Weekly natural gas inventories (previous +104 billion cubic feet).
Energy: Brent oil is priced at $64.50, down about $2 in the past 24 hours due to increased OPEC production starting in June.
Conclusion: The US market is holding its gains, but the likelihood of a correction is growing. It may be reasonable to lock in profits from pullbacks.
Mikhail Makarov, more analytical articles:


