empty
14.05.2025 11:17 AM
GBP/USD Analysis on May 14, 2025

On the hourly chart, the GBP/USD pair continued its upward movement on Tuesday after bouncing off the 1.3139 level. Judging by the wave structure, the bearish trend has not been officially broken yet, but it's hanging by a thread. The growth may continue toward the resistance zone of 1.3344–1.3357. A rebound from this zone would favor the U.S. dollar, but in that case, the bearish trend would be considered violated. A breakout and consolidation above the 1.3344–1.3357 area would increase the likelihood of continued growth toward the next target at 1.3425.

This image is no longer relevant

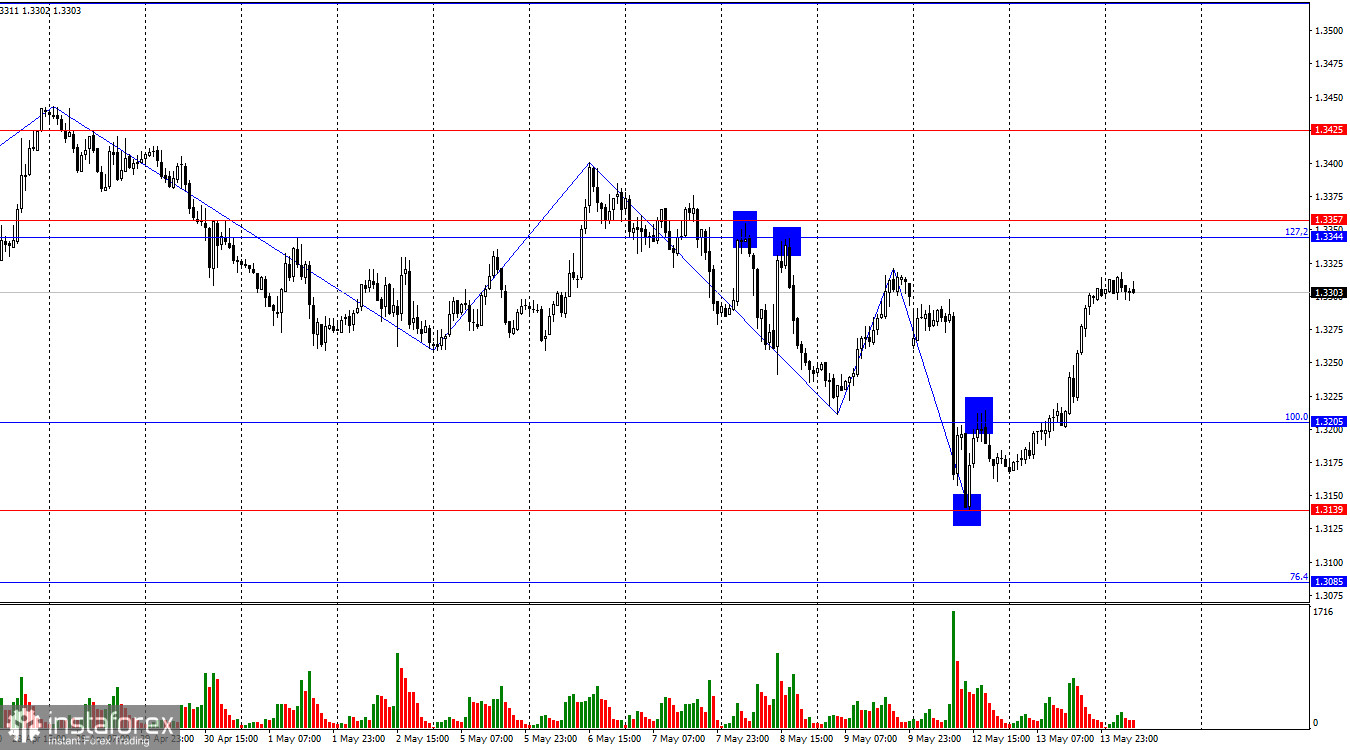
The wave structure has remained simple and clear. The most recent upward wave did not surpass the previous high, while the last downward wave broke the previous low. Thus, the bullish trend has technically morphed into a bearish one. However, the pound's decline hasn't been strong enough to call it a full trend—over the past three months, such drops have been rare and shallow. Bulls will find it difficult to break above 1.3425 without fresh headlines from Donald Trump about new or increased tariffs. But bears aren't having an easy time either.

Tuesday's news flow completely erased the bears' efforts from Monday. Despite rising unemployment in the UK, bulls were on the offensive all day. While their movement was corrective in the first half of the day, the U.S. CPI report released in the second half dramatically changed the market's expectations for the Fed's monetary policy. After headline inflation dropped to 2.3% y/y and core inflation held at 2.8%, traders began demanding a rate cut from the Fed. Many likely concluded that Trump's tariffs aren't leading to runaway inflation, so there's no need for the Fed to maintain its hawkish stance.

However, in my view, inflation might still rise—but no one, not even Fed officials, can predict by how much. Therefore, the current bullish euphoria could be temporary.

This image is no longer relevant

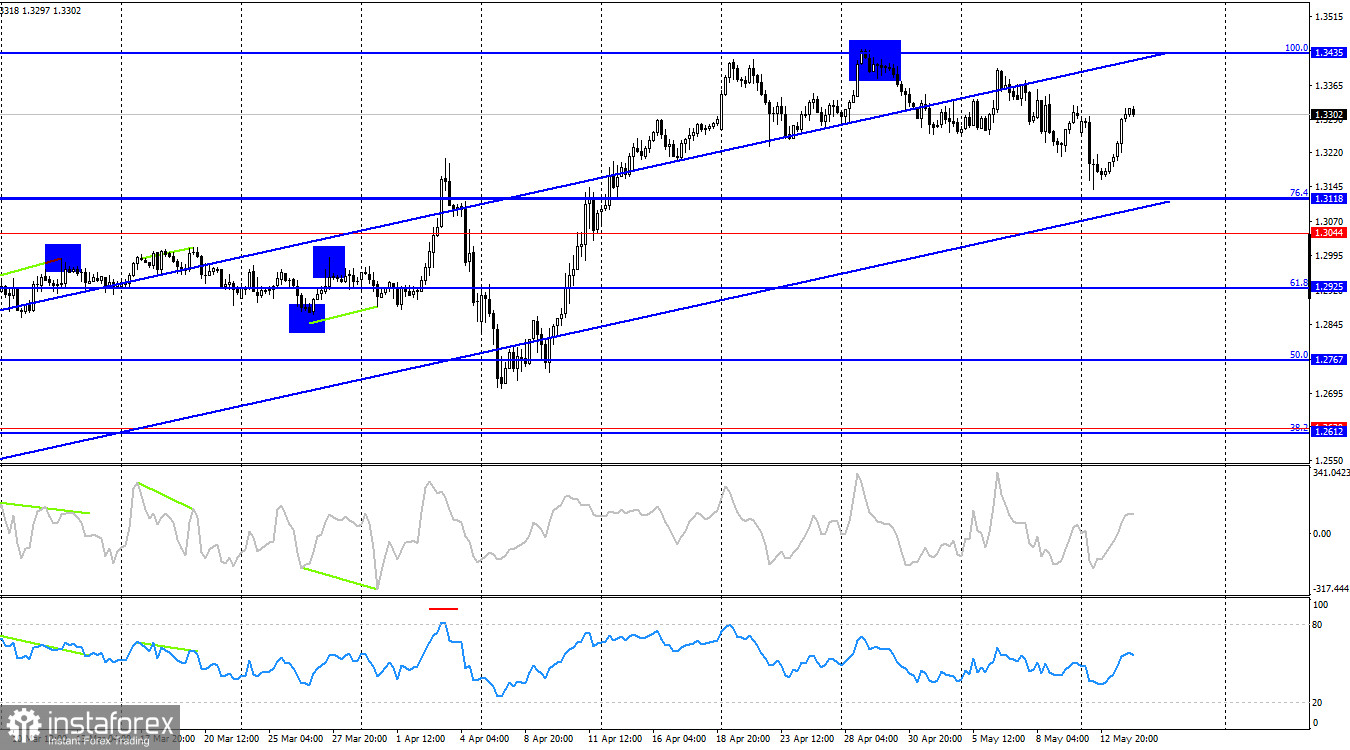
On the 4-hour chart, the pair rebounded from the 100.0% Fibonacci level at 1.3435, reversed in favor of the U.S. dollar, and continued its decline toward the 76.4% corrective level at 1.3118. There are no emerging divergences in any indicators today. The ascending trend channel still indicates a bullish trend. Only a confirmed break below the channel would signal the potential for a sustained bearish move.

Commitments of Traders (COT) Report:

This image is no longer relevant

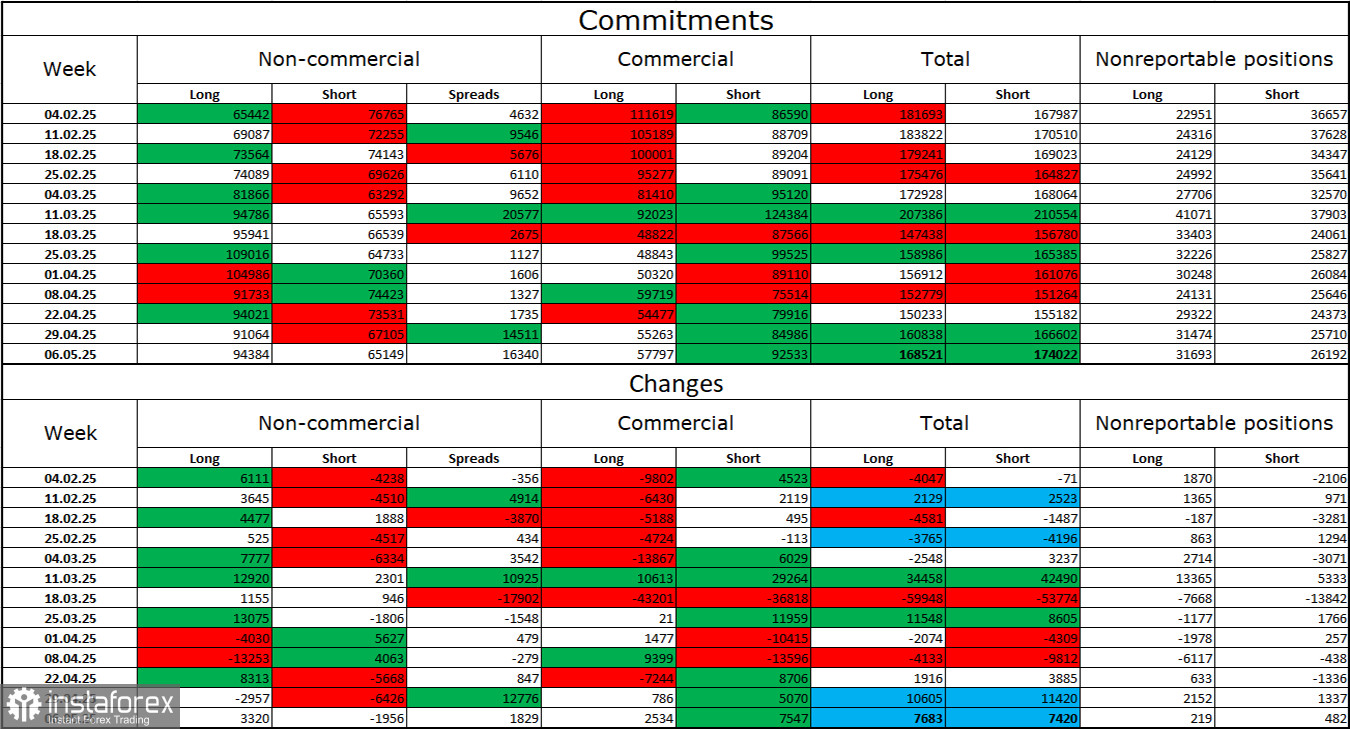
Speculative trader sentiment ("Non-commercial") turned more bullish in the latest reporting week. Long positions increased by 3,320 contracts, while short positions fell by 1,956. The net long position now stands at a 29,000-contract advantage (94,000 vs. 65,000), indicating growing confidence in the pound.

In my view, the pound still faces downside risks, but recent developments could push the market toward a longer-term reversal. Over the past three months, long positions have grown from 65,000 to 94,000, while shorts have decreased from 76,000 to 65,000. Under Donald Trump, faith in the U.S. dollar has faltered, and the COT data suggests traders lack strong conviction to buy the dollar.

Economic Calendar (UK & U.S.):

Wednesday contains no notable economic data releases. Therefore, news flow is unlikely to significantly affect trader sentiment during the rest of the day.

GBP/USD Forecast and Trade Recommendations:

Sell opportunities were available on the hourly chart after a close below the 1.3344–1.3357 zone and following two bounces from this area, with targets at 1.3265 and 1.3205 — both have been surpassed. Today, selling remains possible on a bounce from the 1.3344–1.3357 zone with targets at 1.3205 and 1.3139. Buy opportunities were valid after a confirmed breakout above 1.3205 on the hourly chart, targeting 1.3344 — which may still be achieved today.

Fibonacci Grids:

  • Hourly chart: drawn from 1.3205 to 1.2695
  • 4-hour chart: drawn from 1.3431 to 1.2104
Samir Klishi,
Analytical expert of InstaTrade
© 2007-2025

Recommended Stories

Forex forecast 18/07/2025: EUR/USD, GBP/USD, USD/JPY, Oil, Ethereum and Bitcoin

Useful links: My other articles are available in this section InstaForex course for beginners Popular Analytics Open trading account Important: The begginers in forex trading need to be very careful

Sebastian Seliga 14:51 2025-07-18 UTC+2

GBP/USD. Daily Overview on July 18, 2025

On Thursday, the pair moved downward and nearly tested the lower fractal at 1.3369 (yellow dashed line), then reversed upward and closed the daily candlestick at 1.3412. Today, the pair

Stefan Doll 13:14 2025-07-18 UTC+2

XAU/USD. Analysis and Forecast

Today, gold is rising. The recent price movement within a range observed since the beginning of this month represents the formation of a "rectangle" pattern, indicating trader indecision. In addition

Irina Yanina 13:06 2025-07-18 UTC+2

EUR/USD. Daily Overview on July 18, 2025

On Thursday, the pair moved downward toward the 61.8% retracement level at 1.1650 (red dashed line), then reversed upward, closing the daily candlestick at 1.1560. Today, the price may continue

Stefan Doll 12:49 2025-07-18 UTC+2

Forecast for EUR/USD on July 18, 2025

On Thursday, the EUR/USD pair returned to the 100.0% corrective level at 1.1574 and bounced off it for the second time in a row. This resulted in a reversal

Samir Klishi 12:16 2025-07-18 UTC+2

Forecast for GBP/USD on July 18, 2025

On the hourly chart, the GBP/USD pair on Thursday returned to the support zone of 1.3357–1.3371 and bounced off it again. This resulted in a reversal in favor

Samir Klishi 11:49 2025-07-18 UTC+2

Trading Signals for EUR/USD for July 18-21, 2025: buy above 1.1596 (200 EMA - 7/8 Murray)

Given that the eagle indicator is showing potential for a possible recovery for the euro, we will look for buying opportunities whenever the euro pulls back and trades above 1.1596

Dimitrios Zappas 08:22 2025-07-18 UTC+2

Trading Signals for BITCOIN for July 18-21, 2025: buy above $118,000 (6/8 Murray - 21 SMA)

If Bitcoin makes a technical correction toward the support at 118,750 or the secondary uptrend channel around 118,200 in the coming hours, this will be seen as a buying opportunity

Dimitrios Zappas 08:22 2025-07-18 UTC+2

Trading Signals for GOLD (XAU/USD) for July 18-21, 2025: buy above $3,330 (21 SMA - 5/8 Murray)

Conversely, if gold falls below 3,320 and breaks the uptrend channel, we could expect a trend reversal, and it may reach the 4/8 Murray line at 3,281, eventually reaching

Dimitrios Zappas 07:23 2025-07-18 UTC+2

If XAU/USD successfully breaks through and closes below the Pivot, it has the potential to continue its decline to the next support level, Friday, July 18, 2025.

XAU/USD – Friday, July 18, 2025. The potential for XAU/USD to weaken continues, as reflected in The EMA (50) is below the EMA (200) and the RSI (14)

Arief Makmur 07:02 2025-07-18 UTC+2
Can't speak right now?
Ask your question in the chat.
 

Dear visitor,

Your IP address shows that you are currently located in the USA. If you are a resident of the United States, you are prohibited from using the services of InstaFintech Group including online trading, online transfers, deposit/withdrawal of funds, etc.

If you think you are seeing this message by mistake and your location is not the US, kindly proceed to the website. Otherwise, you must leave the website in order to comply with government restrictions.

Why does your IP address show your location as the USA?

  • - you are using a VPN provided by a hosting company based in the United States;
  • - your IP does not have proper WHOIS records;
  • - an error occurred in the WHOIS geolocation database.

Please confirm whether you are a US resident or not by clicking the relevant button below. If you choose the wrong option, being a US resident, you will not be able to open an account with InstaTrade anyway.

We are sorry for any inconvenience caused by this message.