empty
29.04.2025 11:17 AM
The Stock Market Rally Should Not Be Misleading

This image is no longer relevant

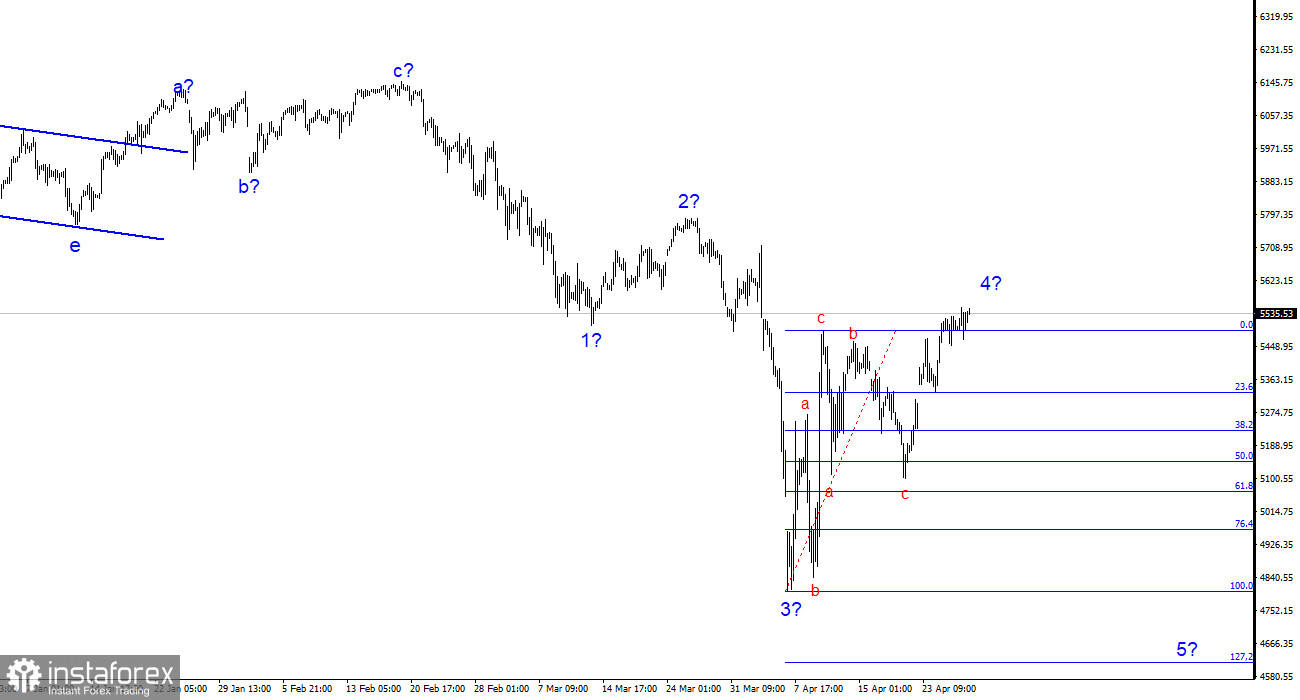
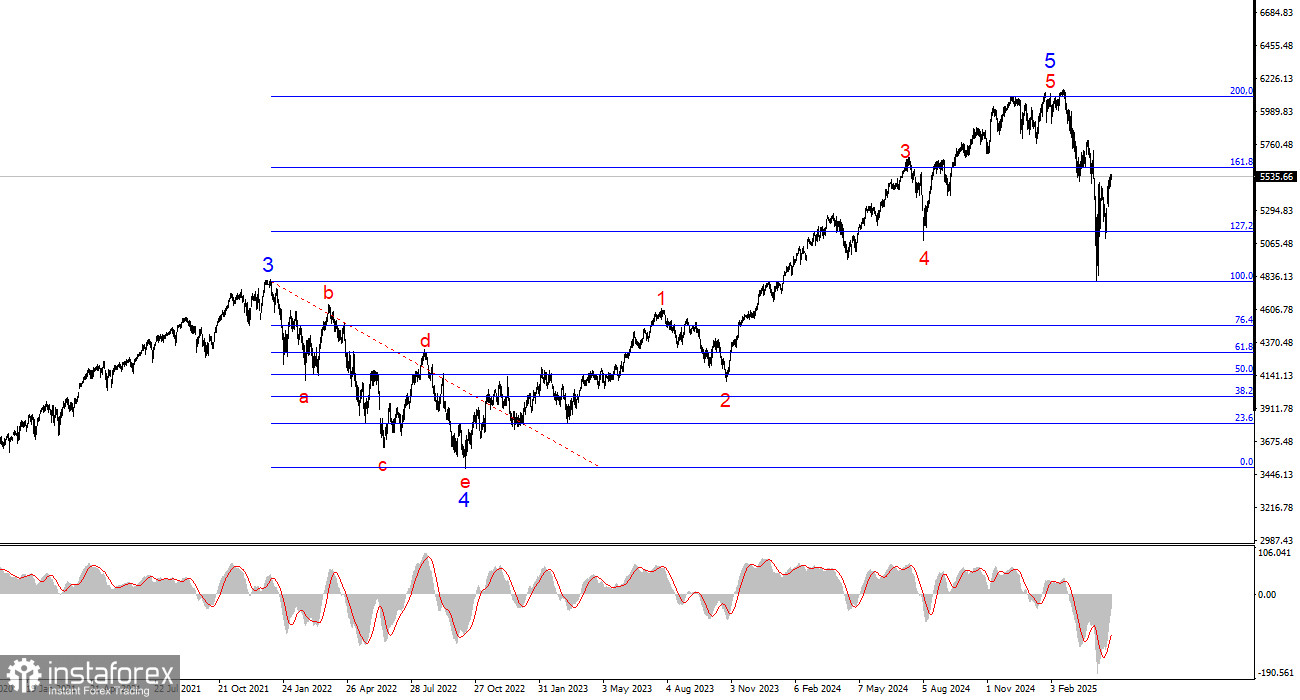
The wave pattern on the 24-hour chart of the #SPX looks generally clear. The global five-wave structure doesn't even fit into the terminal window at its smallest scale. In simple terms, U.S. stock indices have been rising for a very long time. And we know that trends alternate. Currently, the bullish segment of the trend appears to be completed. The instrument made four unsuccessful attempts to break above the 6093 level, which corresponds to 200.0% of Fibonacci wave 4. In my view, we are likely to see an extended corrective wave series. The U.S. stock market has been overheated for too long, and Trump has triggered a chain reaction.

Switching to the 4-hour chart (see image above), we can observe the formation of a new downward segment of the trend, which may turn out to be quite prolonged. Wave 5 is still missing from the structure, so I believe the S&P 500's decline is not over. It's also important to keep in mind that any new tariffs imposed by Trump or retaliatory tariffs against the U.S. could easily trigger new selloffs in the American stock market. The construction of the presumed wave 4 is not yet complete, and it may turn out to be quite complex internally.

The #SPX has bounced back strongly, but the downward segment of the trend remains incomplete. There are simply too many looming problems in the U.S. economy. I see no signs of resolution in the global trade war. From time to time, there are reports that various countries are in talks with the U.S. about trade deals, but these developments are not what markets are truly looking for. What the market wants is de-escalation of the trade war with the European Union and, especially, with China.

We should also note the increasing likelihood of economic deterioration in the U.S. These days, it seems everyone is predicting a recession. And a recession means a shrinking labor market, rising unemployment, and accelerating inflation. Many economists believe the Fed will rush in to save the U.S. economy, but I think that conclusion is far from certain. Jerome Powell has already stated multiple times that no conclusions about economic shifts should be made before summer or even fall. Therefore, no monetary policy easing is expected in the near term. Furthermore, Powell views inflation as the FOMC's top priority, which casts doubt on whether we'll see any rate cuts in 2025 at all. Forecasts that Trump's tariffs will only cause a mild and temporary rise in inflation are just speculation. Let's not forget that in the post-COVID era, very few expected consumer prices to surge by 10% per month. As a rule, expectations and reality often diverge dramatically.

Based on all of the above, I do not believe the S&P 500 is at the beginning of a new bullish trend.

This image is no longer relevant

General Conclusions

Based on the #SPX analysis, I conclude that the bullish segment of the trend is complete. Trump continues to make decisions that threaten the stability of the U.S. economy and American companies (trade wars, tariffs, import duties, export restrictions), which is why we are now observing the emergence of a new downtrend. The "bubble" in the U.S. stock market had been inflating for years, and Trump has now popped it. The 4-hour chart also suggests further downside. Currently, wave 5 is expected to form, which implies a new decline toward the 4,614 level.

At the higher timeframe, the wave pattern is much clearer: a well-defined five-wave structure with a five-wave substructure inside the fifth wave. The bullish trend segment is over. Accordingly, I would prepare for a new bearish trend segment, which has already begun.

Core Principles of My Analysis:

  1. Wave structures should be simple and understandable. Complex patterns are hard to trade and often lead to revisions.
  2. If you're uncertain about what's happening in the market, it's better to stay out.
  3. Absolute certainty about market direction does not and cannot exist. Always use protective Stop Loss orders.
  4. Wave analysis can be combined with other forms of analysis and trading strategies.
Chin Zhao,
Analytical expert of InstaTrade
© 2007-2025

Recommended Stories

Stock market on August 12: S&P 500 and Nasdaq edge lower

US stock indices ended yesterday's session with losses. The S&P 500 fell by 0.25%, while the Nasdaq 100 slipped by 0.30%. The industrial Dow Jones dropped by 0.45%. However

Jakub Novak 09:29 2025-08-12 UTC+2

Stock market on August 11: S&P 500 and NASDAQ return to growth

Last Friday, US stock indices closed higher. The S&P 500 gained 0.78%, while the Nasdaq 100 added 0.97%. The industrial Dow Jones rose by 0.47%. Today, US and European stock

Jakub Novak 08:12 2025-08-11 UTC+2

Stock market on August 8: S&P 500 and Nasdaq see minor correction

As of yesterday's close, US stock indices finished mixed. The S&P 500 fell by 0.08%, while the Nasdaq 100 gained 0.35%. The Dow Jones Industrial Average declined by 0.51%. European

Jakub Novak 10:15 2025-08-08 UTC+2

US market on track for all-time highs. Focus on trade wars

US stock markets continue to climb. The euphoria of recent days is driven by several factors at once: strong corporate earnings, impressive news from Apple, and increasingly realistic expectations

Anna Zotova 15:10 2025-08-07 UTC+2

Stock market on August 7: SP500 and NASDAQ resume their rally

At the end of the previous trading day, US stock indices closed in the green. The S&P 500 rose by 0.73%, while the Nasdaq 100 gained 1.21%. The Dow Jones

Jakub Novak 09:03 2025-08-07 UTC+2

Stock market on August 6: S&P 500 and NASDAQ remain volatile

By the end of yesterday's session, US stock indices closed lower. The S&P 500 dropped by 0.49%, while the Nasdaq 100 lost 0.45%. The industrial Dow Jones slipped by 0.14%

Jakub Novak 09:36 2025-08-06 UTC+2

Stock Market on August 5: S&P 500 and NASDAQ recover some ground

At the close of trading on August 5, US stock indices regained part of Friday's losses. The S&P 500 rose by 1.47%, while the Nasdaq 100 added 1.95%

Jakub Novak 13:07 2025-08-05 UTC+2

US markets: key drivers, looming risks, and fresh incentive for Musk

US indices are once again charging toward record highs. After a tense week, when the market stumbled over trade wars and a weak labor market, the momentum is shifting back

Anna Zotova 13:07 2025-08-05 UTC+2

Stock Market on August 4: SP500 and NASDAQ plunge

At the close of trading yesterday, US stock indices ended in the red. The S&P 500 fell by 1.60%, while the Nasdaq 100 dropped by 2.24%. The Dow Jones Industrial

Jakub Novak 10:50 2025-08-04 UTC+2

S&P 500 Forecast for August 4, 2025

A divergence has formed on the monthly chart of the S&P 500. The entire growth of the index from March 2020 to July 2025 fits neatly into the Fibonacci grid

Laurie Bailey 05:01 2025-08-04 UTC+2
Can't speak right now?
Ask your question in the chat.
 

Dear visitor,

Your IP address shows that you are currently located in the USA. If you are a resident of the United States, you are prohibited from using the services of InstaFintech Group including online trading, online transfers, deposit/withdrawal of funds, etc.

If you think you are seeing this message by mistake and your location is not the US, kindly proceed to the website. Otherwise, you must leave the website in order to comply with government restrictions.

Why does your IP address show your location as the USA?

  • - you are using a VPN provided by a hosting company based in the United States;
  • - your IP does not have proper WHOIS records;
  • - an error occurred in the WHOIS geolocation database.

Please confirm whether you are a US resident or not by clicking the relevant button below. If you choose the wrong option, being a US resident, you will not be able to open an account with InstaTrade anyway.

We are sorry for any inconvenience caused by this message.