empty
28.04.2025 06:49 AM
GOLD – Technical Analysis Overview

This image is no longer relevant

Last week, the bulls updated historical highs and formed a new maximum extremum at 3499.58. Afterward, gold entered a downward correction towards the support of the daily short-term trend at 3346.45. The market has taken a pause. If bearish sentiment receives a new impulse for development, the next target will be the daily medium-term trend at 3227.79, and then the corrective decline may extend toward the support of the weekly short-term trend at 3164.81. Eliminating the daily golden cross at 3163.64 and consolidating below the weekly levels at 3164.81–3131.58 would open up new bearish prospects.

This image is no longer relevant

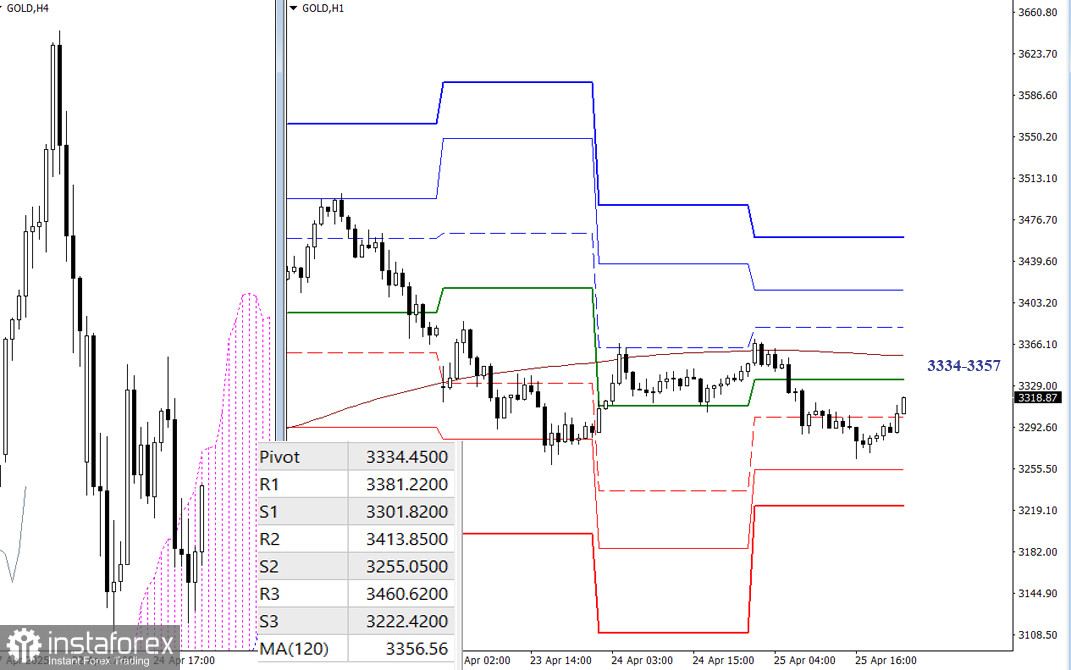
On the lower timeframes, the main advantage remains with the bears. The market is operating below the key levels, currently at 3334.45 (the daily central Pivot level) and 3356.56 (the weekly long-term trend). Consolidation above the trend line and its reversal could shift the current balance of forces in favor of further bullish recovery. Resistance levels will be important for the bulls if the market starts developing directed movements, and support levels will be important for the bears according to the classic pivot points. Pivot levels are updated daily, and new actual data will appear at the opening of trading.

***

Technical Analysis Components:
  • Higher Timeframes: Ichimoku Kinko Hyo (9.26.52) and Fibonacci Kijun levels
  • H1: Classic Pivot Points and 120-period Moving Average (weekly long-term trend)
Evangelos Poulakis,
Analytical expert of InstaTrade
© 2007-2025

Recommended Stories

Despite the potential for a correction to its nearest support level, USD/CHF still has the potential to return to its bullish bias on Tuesday, July 15, 2025.

USD/CHF - Tuesday, July 15, 2025. With the Golden Cross condition between EMA(50) and EMA(200) indicates that buyers still dominate, although there is potential for a correction in the near

Arief Makmur 07:31 2025-07-15 UTC+2

If the Fiber strengthening is held at its Resistance 1 level, EUR/USD has the potential to weaken again on Tuesday, July 15, 2025.

EUR/USD - Tuesday, July 15, 2025. Although the RSI(14) is at 55.39 (Neutral-Bullish), the EMA(50) is below the EMA(200), indicating that despite the upward retracement, the potential for a continued

Arief Makmur 07:31 2025-07-15 UTC+2

EUR/USD Forecast for July 15, 2025

On the daily chart, the price has consolidated below the 1.1692 level. The Marlin oscillator is currently entering the territory of a downward trend. The target at 1.1535

Laurie Bailey 05:12 2025-07-15 UTC+2

GBP/USD Forecast for July 15, 2025

By the end of Monday, the British pound consolidated below the balance indicator line, having approached the target support level at 1.3369 by 65 points. The signal line

Laurie Bailey 05:12 2025-07-15 UTC+2

USD/JPY Forecast for July 15, 2025

Following a rebound from the support level at 146.11, the USD/JPY pair has reached the upper line of the wedge pattern on the daily chart and is now targeting

Laurie Bailey 05:12 2025-07-15 UTC+2

USD/JPY. Analysis and Forecast

The USD/JPY pair remains in a consolidation phase near a three-week high, supported by U.S. dollar strength and mixed market signals. The dollar is being bolstered by U.S. President Donald

Irina Yanina 12:17 2025-07-14 UTC+2

Technical Analysis for the Week of July 14–19: GBP/USD Currency Pair

Last week, the pair moved downward and broke below the 8-period EMA at 1.3509 (thin blue line), closing the weekly candle at 1.3487. In the upcoming week, the price

Stefan Doll 11:40 2025-07-14 UTC+2

Technical Analysis for the Week of July 14–19: EUR/USD Currency Pair

Last week, the pair moved downward and nearly tested the 23.6% retracement level at 1.1647 (blue dashed line), after which the price turned upward and closed the weekly candle

Stefan Doll 11:34 2025-07-14 UTC+2

Forecast for EUR/USD on July 14, 2025

On Friday, the EUR/USD pair rebounded from the 127.2% Fibonacci retracement level at 1.1712, reversed in favor of the U.S. dollar, and resumed its decline toward the 1.1645 level

Samir Klishi 11:31 2025-07-14 UTC+2

Forecast for GBP/USD on July 14, 2025

On the hourly chart, the GBP/USD pair on Friday consolidated below the 127.2% Fibonacci level at 1.3527 and continued its decline toward the next retracement level of 100.0% at 1.3444

Samir Klishi 11:25 2025-07-14 UTC+2
Can't speak right now?
Ask your question in the chat.
 

Dear visitor,

Your IP address shows that you are currently located in the USA. If you are a resident of the United States, you are prohibited from using the services of InstaFintech Group including online trading, online transfers, deposit/withdrawal of funds, etc.

If you think you are seeing this message by mistake and your location is not the US, kindly proceed to the website. Otherwise, you must leave the website in order to comply with government restrictions.

Why does your IP address show your location as the USA?

  • - you are using a VPN provided by a hosting company based in the United States;
  • - your IP does not have proper WHOIS records;
  • - an error occurred in the WHOIS geolocation database.

Please confirm whether you are a US resident or not by clicking the relevant button below. If you choose the wrong option, being a US resident, you will not be able to open an account with InstaTrade anyway.

We are sorry for any inconvenience caused by this message.