See also

 14.04.2025 12:16 PM
EUR/USD
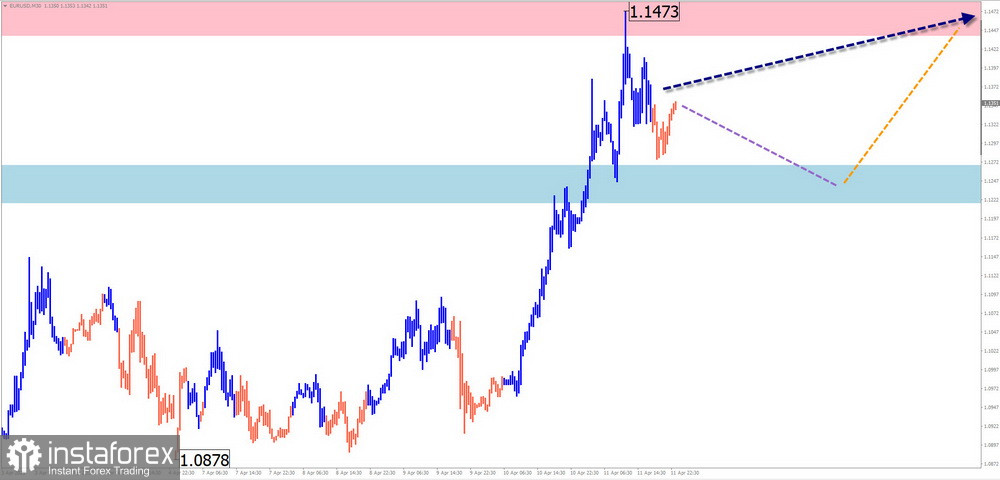
Analysis: On the 4-hour chart of the euro major pair, an upward trend has been developing since early February. The structure of the wave has been forming its final segment (C) over recent weeks. Currently, the quotes have reached the boundaries of a strong potential reversal zone on the daily time frame.
Forecast: In the coming week, price fluctuations are expected to shift mostly into a sideways range. A gradual pullback toward the lower boundary of the price corridor is more likely in the first half of the week. Price growth may resume closer to the weekend.
Potential Reversal Zones:
Recommendations:
USD/JPY
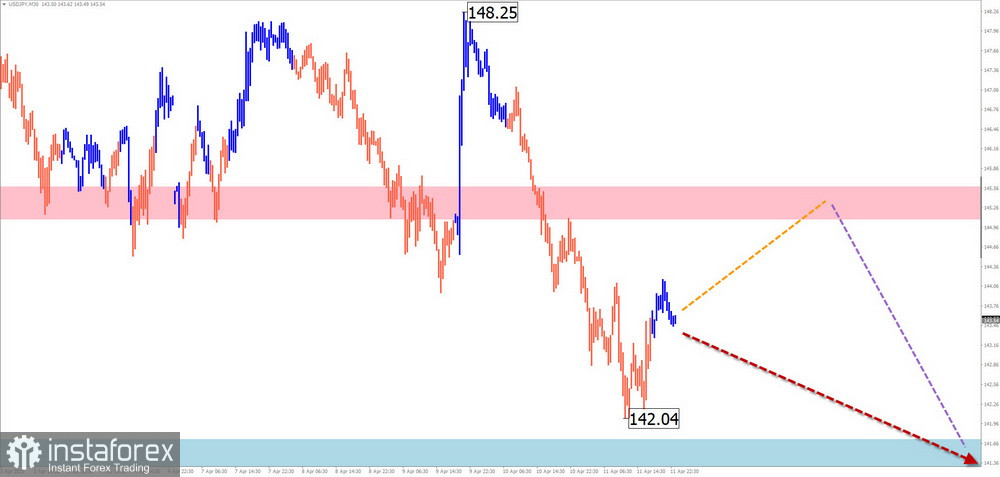
Analysis: Since December last year, a downward wave has defined the trend for the Japanese yen's major pair. The incomplete segment from April 9 determines the current short-term movements. At the end of last week, the price broke through strong support and is now forming a corrective pullback.
Forecast: At the start of the week, the price is expected to move along a strong reversal zone of the higher time frame, which now serves as resistance. Toward the weekend, a trend reversal and resumption of the downtrend may occur.
Potential Reversal Zones:
Recommendations:
GBP/JPY
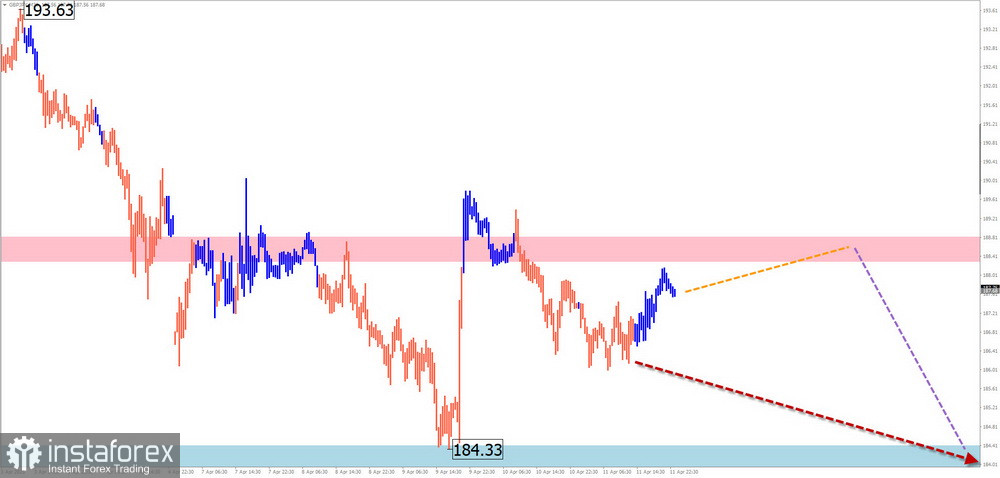
Analysis: A bearish trend has guided the short-term movements of the pound against the yen over the past month. The main wave segment has been unfolding since April 9. Recently, the price has been forming a corrective pullback along calculated resistance.
Forecast: The pair is expected to continue moving sideways within the indicated price range this week. Early pressure on the upper boundary of resistance is possible, followed by a potential trend reversal and resumption of the downtrend.
Potential Reversal Zones:
Recommendations:
USD/CAD
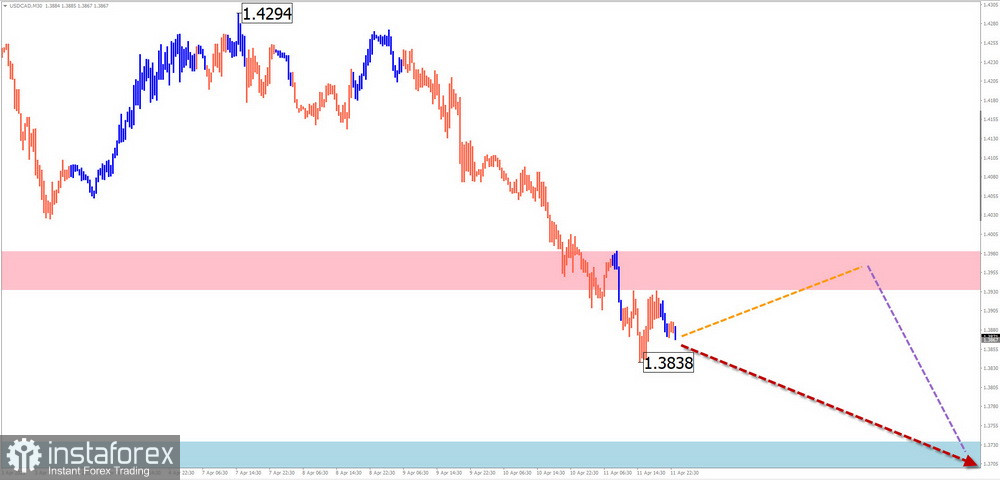
Analysis: Short-term prospects for the Canadian dollar pair are governed by an incomplete bearish wave from February 3. Last week, the price broke through an intermediate support zone, which then became resistance, followed by a correction. This correction is still ongoing.
Forecast: Early in the week, the price is expected to move along the boundaries of the resistance zone, with a potential trend reversal and resumption of the downward movement expected later.
Potential Reversal Zones:
Recommendations:
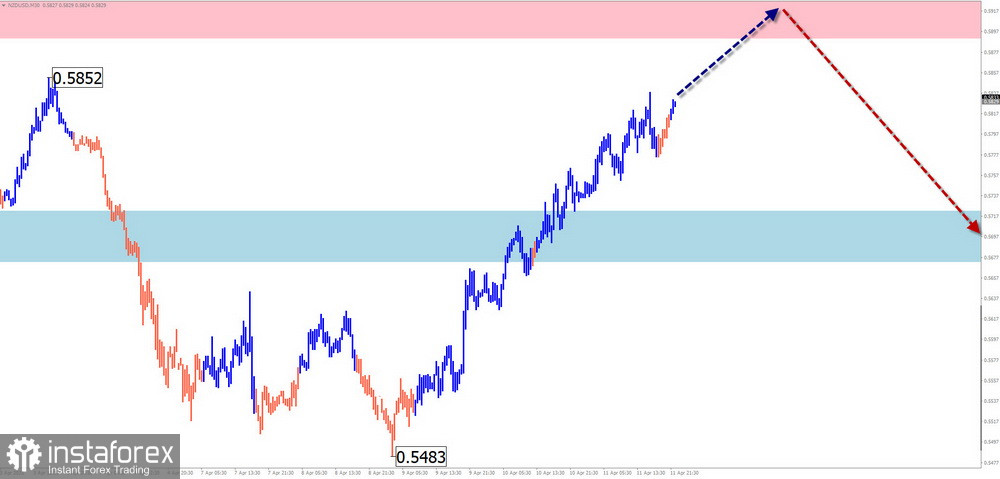
NZD/USD
Analysis: Since last autumn, the New Zealand dollar pair has followed a downward structure. As of April 9, a potentially reversal upward wave has begun. If confirmed by a correction, it may signal a shift in the short-term trend.
Forecast: Continued price growth is likely in the coming days. Near the resistance zone, a sideways movement may form, setting the stage for a downward reversal closer to the weekend.
Potential Reversal Zones:
Recommendations:
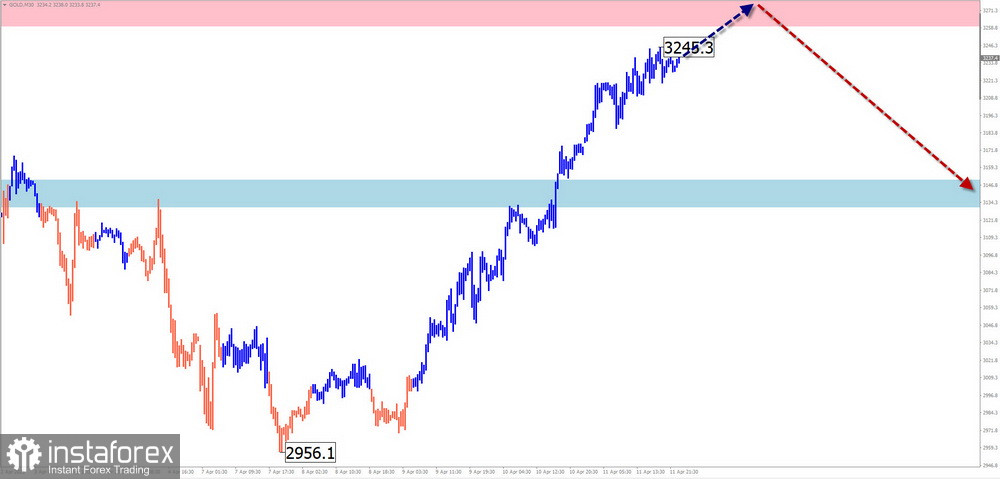
GOLD
Analysis: The bullish wave that began in September of last year has once again pushed gold to record highs, entering a strong potential reversal zone on the weekly chart. The latest incomplete part of this trend wave started on April 7 and is currently at the upper edge of the reversal zone.
Forecast: Upward momentum may continue over the next couple of days, potentially testing the top of the resistance zone. After that, a reversal and downward correction toward support levels is possible.
Potential Reversal Zones:
Recommendations:
Notes: In simplified wave analysis (SWA), all waves consist of 3 parts (A-B-C). The last incomplete wave is analyzed on each time frame. Expected price movements are shown as dotted lines.
Caution: The wave algorithm does not take the duration of market movements into account!


