See also

 04.04.2025 07:29 AM
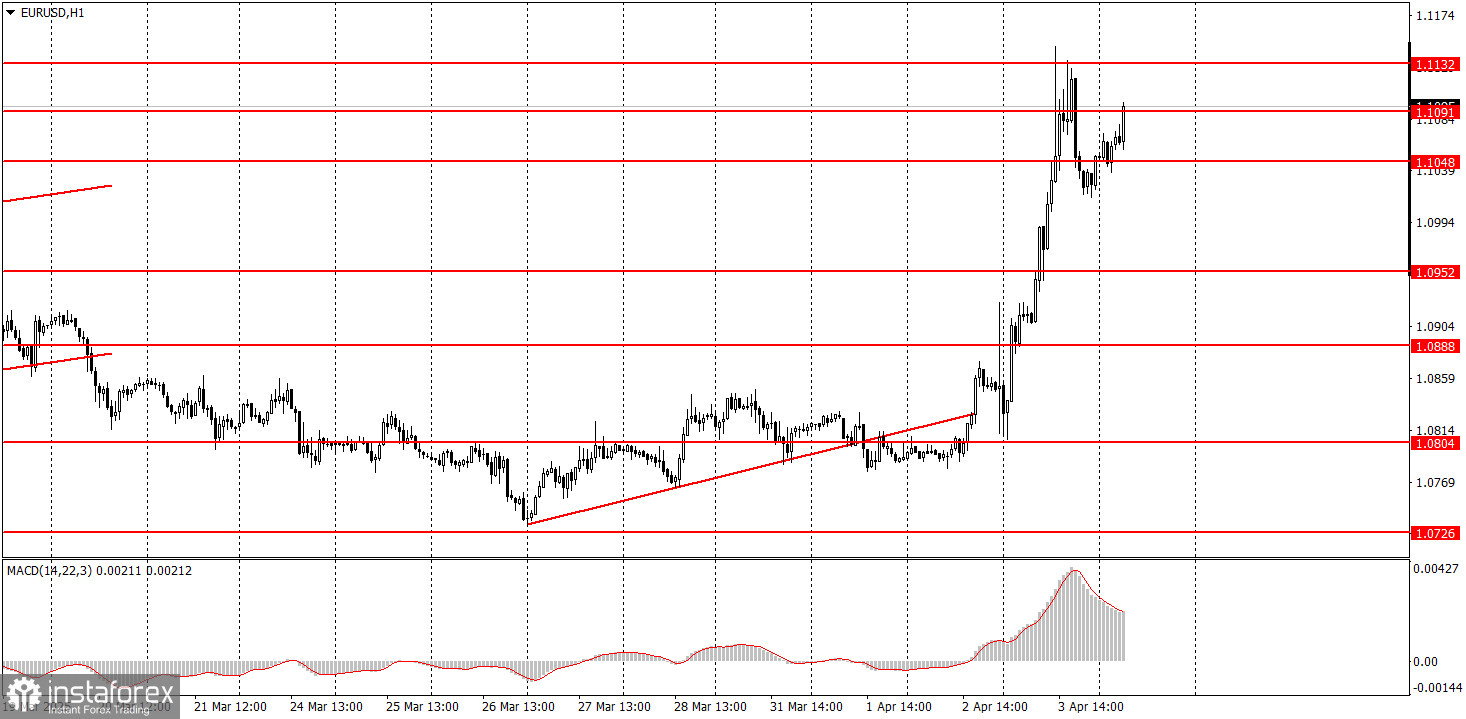
The EUR/USD currency pair posted a strong upward move on Thursday. There was only one reason for this situation: Donald Trump. This is no longer news, as the world has been discussing the new tariffs for over a day. As expected, the dollar is plunging, with the market reacting to Trump's trade initiatives by selling the greenback. At the beginning of the week, we wondered if traders had lost interest in this topic — as it turned out on Wednesday, they had not. All other macroeconomic and fundamental events can be disregarded, as they did not influence the pair's movements throughout the day. Although not necessarily broken, the technical situation on higher timeframes appears quite unusual — in other words, the market seems to be ignoring it. On the lower timeframes, we see moves "from Trump to Trump." While the U.S. President is silent, the market remains relatively stable; the moment he announces new tariffs — the market is hit by a storm and the dollar tumbles.
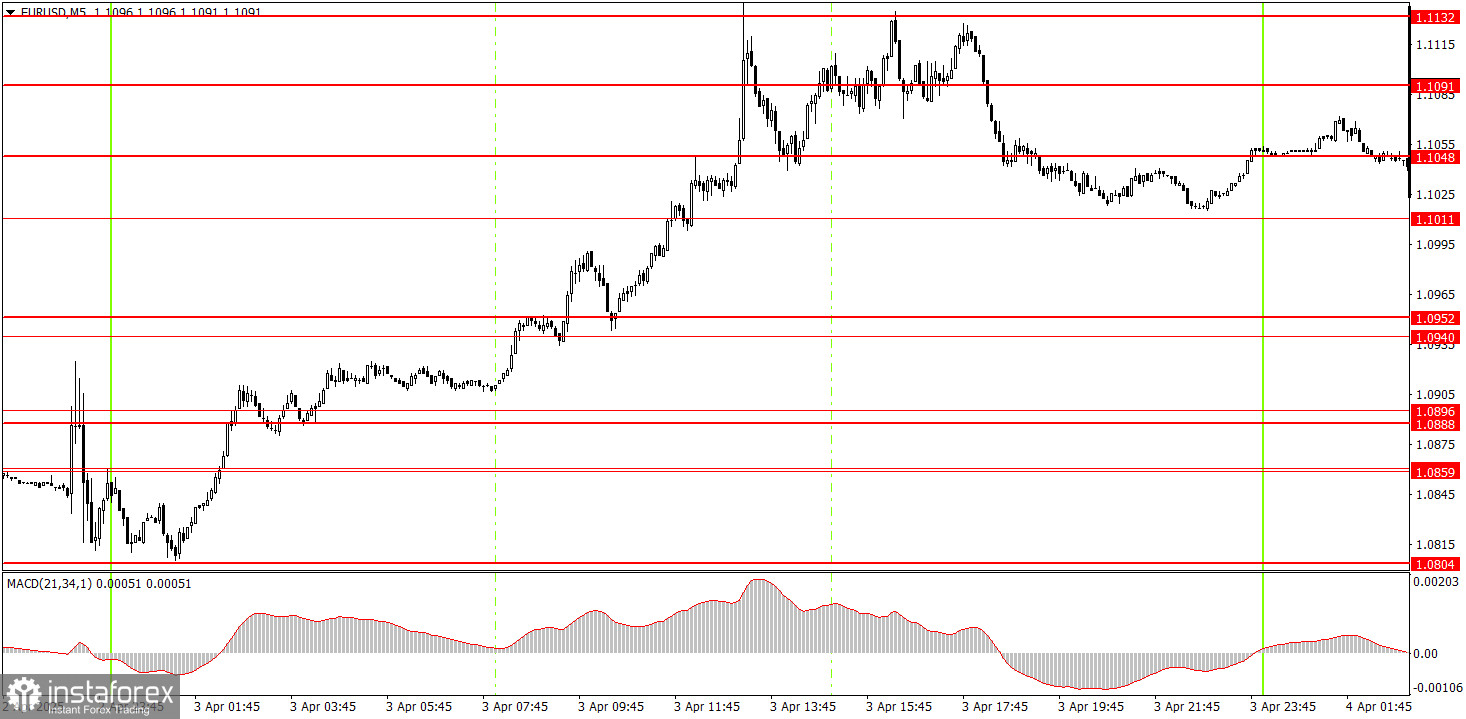
In the 5-minute timeframe, more than 10 trading signals were generated on Thursday. We didn't even plot them all on the chart illustration, as it would have been completely covered in yellow. For most of the day, the price only moved upward, breaking through one level after another. Long positions could be opened practically anywhere. The northern move ended only around the 1.1132 level, from which the price bounced three times. However, this does not mean that the decline of the dollar has come to an end. If you're uncomfortable trading in such volatility, we recommend waiting until the market becomes more stable.
The EUR/USD pair has resumed its upward movement on the hourly timeframe. At this point, the euro's rise appears to have become an independent trend. How long this will last remains unknown, as no one can predict how many additional trade tariffs Trump might impose. A repeated trade war escalation is very likely, as many countries are planning symmetrical responses. Trump has already warned that any countermeasures will trigger new tariffs from the U.S.
On Friday, the markets will most likely remain in a state of shock. We are not attempting to predict price movements. At least three major events are scheduled in the U.S. today, so volatility could remain extremely high.
On the 5-minute timeframe, the levels to watch are: 1.0596, 1.0678, 1.0726–1.0733, 1.0797–1.0804, 1.0859–1.0861, 1.0888–1.0896, 1.0940–1.0952, 1.1011, 1.1048, 1.1091, 1.1132–1.1140, 1.1189–1.1191, and 1.1275–1.1292. On Friday, we cannot ignore the release of the Nonfarm Payrolls report, the unemployment rate, and Jerome Powell's speech. These are significant events, but predicting how they will play out on the charts is impossible. The market still hasn't recovered from Trump's full-scale trade war.
Support and Resistance Levels: These are target levels for opening or closing positions and can also serve as points for placing Take Profit orders.
Red Lines: Channels or trendlines indicating the current trend and the preferred direction for trading.
MACD Indicator (14,22,3): A histogram and signal line used as a supplementary source of trading signals.
Important Events and Reports: Found in the economic calendar, these can heavily influence price movements. Exercise caution or exit the market during their release to avoid sharp reversals.
Forex trading beginners should remember that not every trade will be profitable. Developing a clear strategy and practicing proper money management are essential for long-term trading success.


