See also

 02.04.2025 12:17 PM
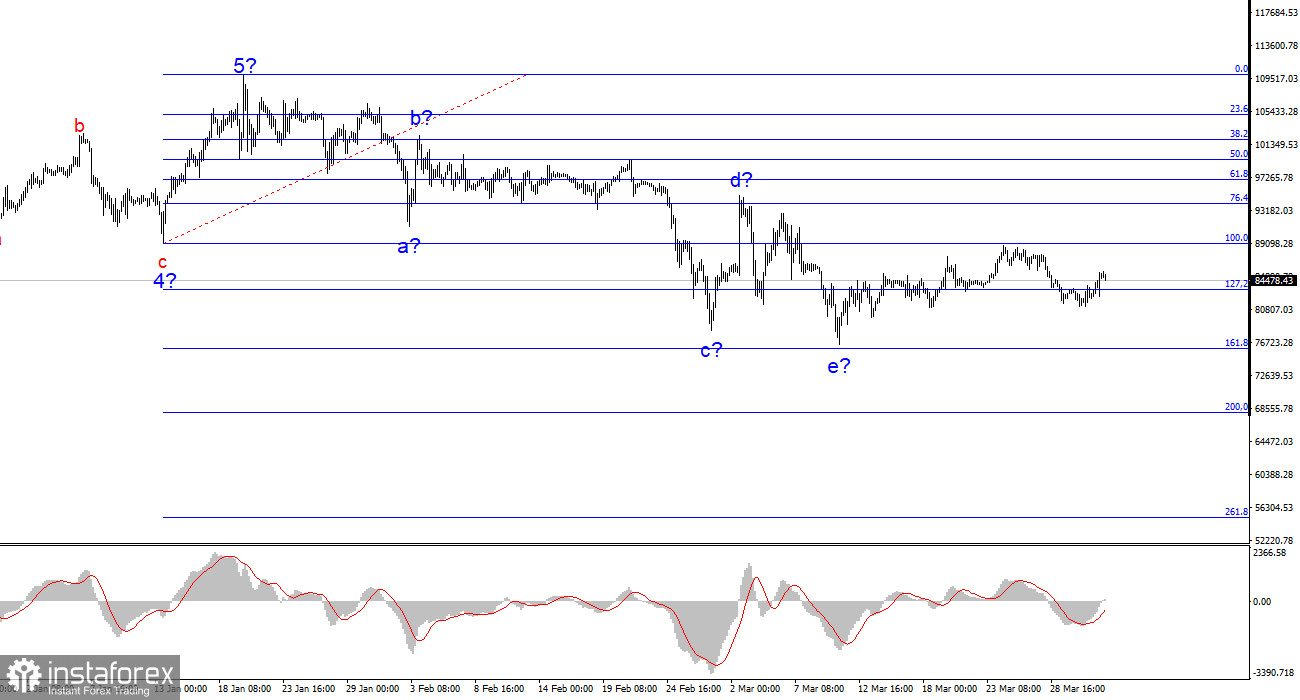
The wave pattern on the 4-hour BTC/USD chart is clear. After completing a bullish trend composed of five full waves, a downward corrective phase began, which is still in progress. Based on this, I did not—and still do not—expect Bitcoin to rise above $110,000–$115,000 in the coming months.
The news backdrop had been supporting Bitcoin thanks to a steady flow of headlines about new investments from institutional traders, various governments, and pension funds. However, Trump and his policies have caused investors to exit the market—no trend can rise indefinitely. The wave that began on January 20 does not resemble an impulsive one. Thus, we are dealing with a complex corrective structure that could take months to form. Internally, this first wave is quite intricate, but a five-wave a-b-c-d-e structure within it can be distinguished. If the current wave count is correct, we are now seeing the formation of an upward corrective wave, which in classical theory consists of three waves. Waves a and b appear to be complete.
The BTC/USD rate has stabilized, and the current wave count suggests further upward movement. But how strong might this growth be? Many in the market panic if Bitcoin drops by $10,000–$15,000. However, given Bitcoin's extreme volatility, such a move can occur in just a few days. The price fell $33,000 from its all-time high—and even that correction doesn't seem excessive enough to expect a fresh bullish trend.
Therefore, I anticipate a corrective wave or series of waves, after which the broader corrective structure will continue to develop.
At the moment, Bitcoin is consolidating, and the market is waiting. Some might view a drop to $80,000 as sufficient—but let me remind you of the period from November 2021 to November 2022, when Bitcoin fell from $69,000 to $16,000. Back then, economists and crypto analysts also predicted continued growth and a target of $100,000, but Bitcoin lost nearly 80% of its value. Why couldn't a similar scenario unfold now?
That previous decline lasted a full year. This one has been unfolding for only 2.5 months. Trump may announce new global tariffs as soon as today, and under Donald Trump, Bitcoin tends to fall. It's quite symbolic that the decline began on January 20—Trump's inauguration day.
Given the above and the current wave structure, I believe the downtrend will continue.
Based on the BTC/USD analysis, I conclude that the current growth phase is over. All signs point toward a complex, multi-month correction. That's why I have previously advised against buying crypto—and now, even more so. A drop below the low of wave 4 indicates a transition into a downward trend phase, most likely of a corrective nature.
In this context, the best strategy is to look for selling opportunities. A short-term upward corrective wave may occur soon, during which new short positions can be considered with targets near $68,000 and possibly as low as $55,000.
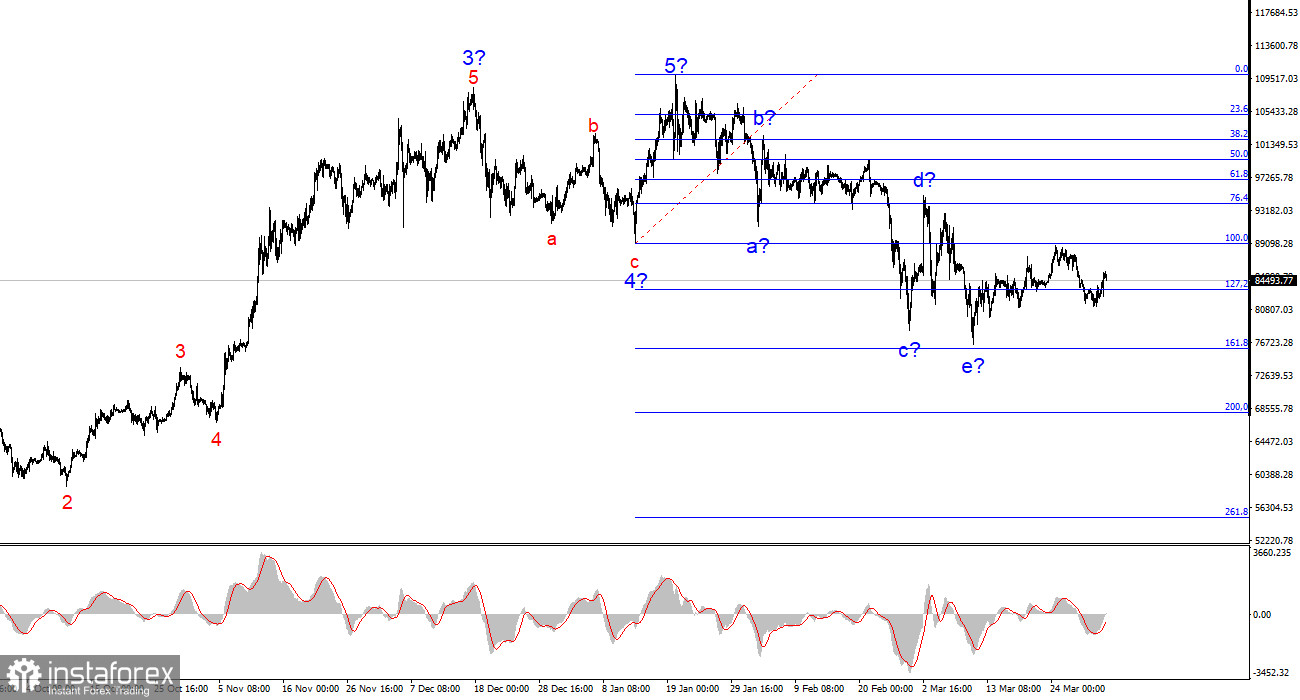
Higher Timeframe Outlook
On the higher wave scale, a five-wave bullish structure is visible. We are now witnessing the beginning of a corrective or bearish wave structure, potentially marking a new downtrend.
Core Principles of My Analysis:


