See also

 02.04.2025 06:25 AM
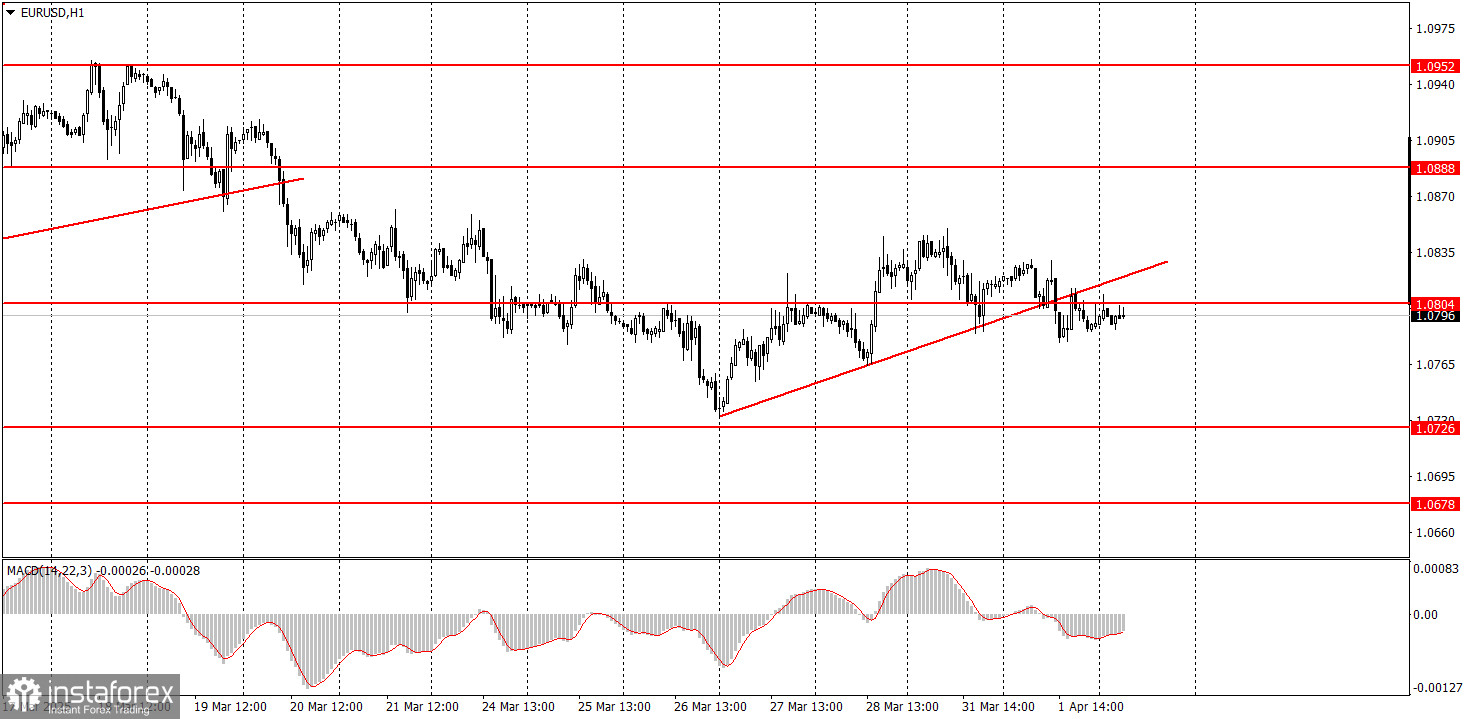
On Tuesday, the EUR/USD currency pair continued to trade in the same mode as in previous weeks. What does that mean? Relatively weak movements, frequent pullbacks and corrections, no clear intraday direction, and overall confusion. We want to remind novice traders that market price movements can vary greatly. Trading signals can also be varied. The number one task for a trader is to trade during a favorable time for them and their trading system. It's no secret that trading systems can be trend-following or range-based. A trend-following system won't work in a flat market. Therefore, during flat conditions, the system must be temporarily adjusted.
Yesterday, a series of fairly important reports from the Eurozone and the U.S. failed to provoke decent price moves. Inflation in the EU slowed down but didn't create significant problems for the euro. U.S. JOLTS and ISM indexes came out weaker than expected, yet the dollar didn't show any notable decline. The market continues to wait and ignore.
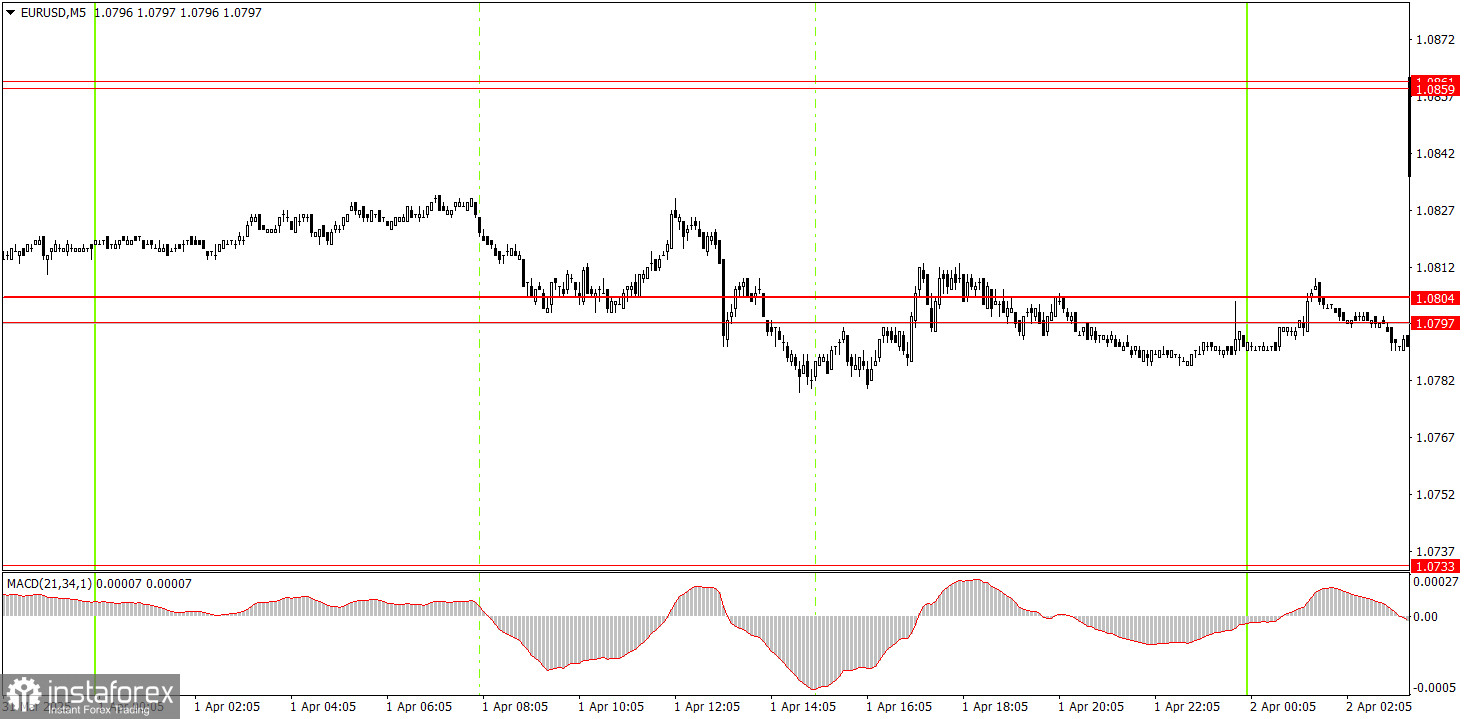
In the 5-minute timeframe, several trading signals were formed on Tuesday, but there's no point in analyzing them. The 1.0797–1.0804 area was crossed and tested multiple times throughout the day. It was impossible to know in advance how the movements would unfold. However, traders could have worked with the first and second signals. Both turned out to be false, but neither resulted in losses. After that, it was better not to open any more positions.
In the 1-hour timeframe, the EUR/USD pair remains in a medium-term downtrend, but the likelihood of its continuation is decreasing. Since the fundamental and macroeconomic backdrop still favors the U.S. dollar far more than the euro, we continue to expect a decline. However, Donald Trump continues to exert significant pressure on the dollar, and the market is visibly nervous and unable to settle on a clear strategy.
The pair may resume its downward movement on Wednesday, but this week is full of important events, which could only add more confusion. Also, today is April 2, and we still haven't heard which tariffs Trump decided to implement.
On the 5-minute chart, consider the following levels for Wednesday: 1.0433–1.0451, 1.0526, 1.0596, 1.0678, 1.0726–1.0733, 1.0797–1.0804, 1.0859–1.0861, 1.0888–1.0896, 1.0940–1.0952, 1.1011, 1.1048.
We note the ADP employment change report in the U.S. from important reports, though it is conditionally important. While there may be some market reaction to this report, the Nonfarm Payrolls report released on Friday is more critical, as it provides a clearer picture of the labor market conditions.
Support and Resistance Levels: These are target levels for opening or closing positions and can also serve as points for placing Take Profit orders.
Red Lines: Channels or trendlines indicating the current trend and the preferred direction for trading.
MACD Indicator (14,22,3): A histogram and signal line used as a supplementary source of trading signals.
Important Events and Reports: Found in the economic calendar, these can heavily influence price movements. Exercise caution or exit the market during their release to avoid sharp reversals.
Forex trading beginners should remember that not every trade will be profitable. Developing a clear strategy and practicing proper money management are essential for long-term trading success.


