empty
28.03.2025 10:09 AM
EUR/USD and GBP/USD March 28 – Technical Analysis

EUR/USD

This image is no longer relevant

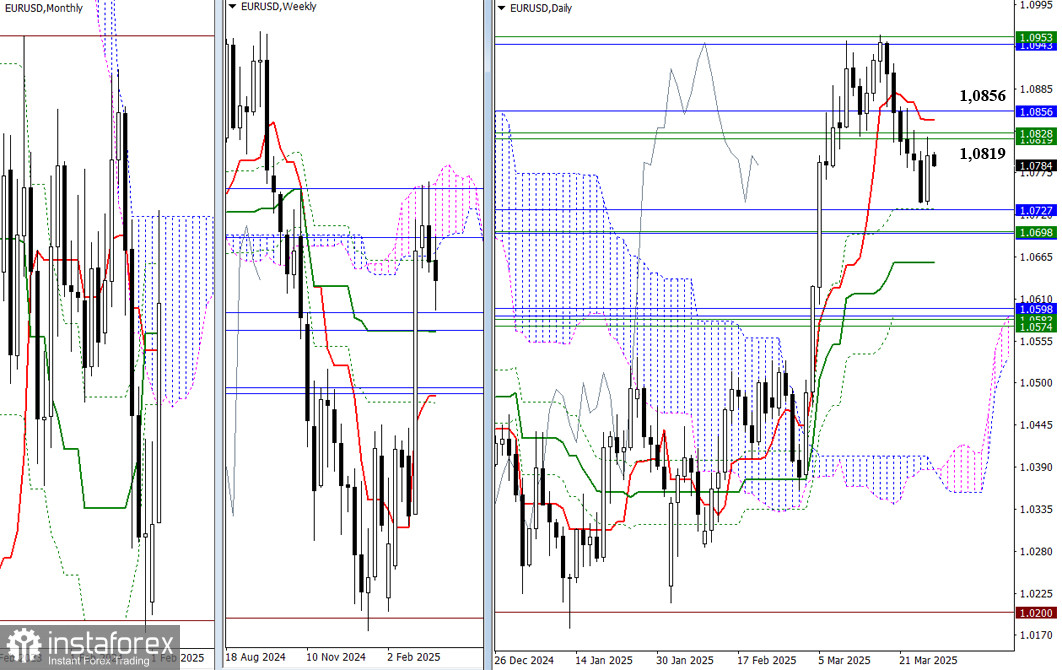
As the week comes to an end, the market remains indecisive, with no clear preferences evident. Yesterday, the bulls made some progress, adjusting the prevailing bearish sentiment. To confirm and consolidate the result, they need to overcome the cluster of resistance levels from various timeframes in the 1.0819–1.0856 area. After that, a new opportunity for further growth will open up, with the following targets being the upper boundaries of the weekly (1.0953) and monthly (1.0943) Ichimoku clouds. If the bulls surrender their gains from yesterday, the pair may return to support levels around 1.0727–1.0694.

This image is no longer relevant

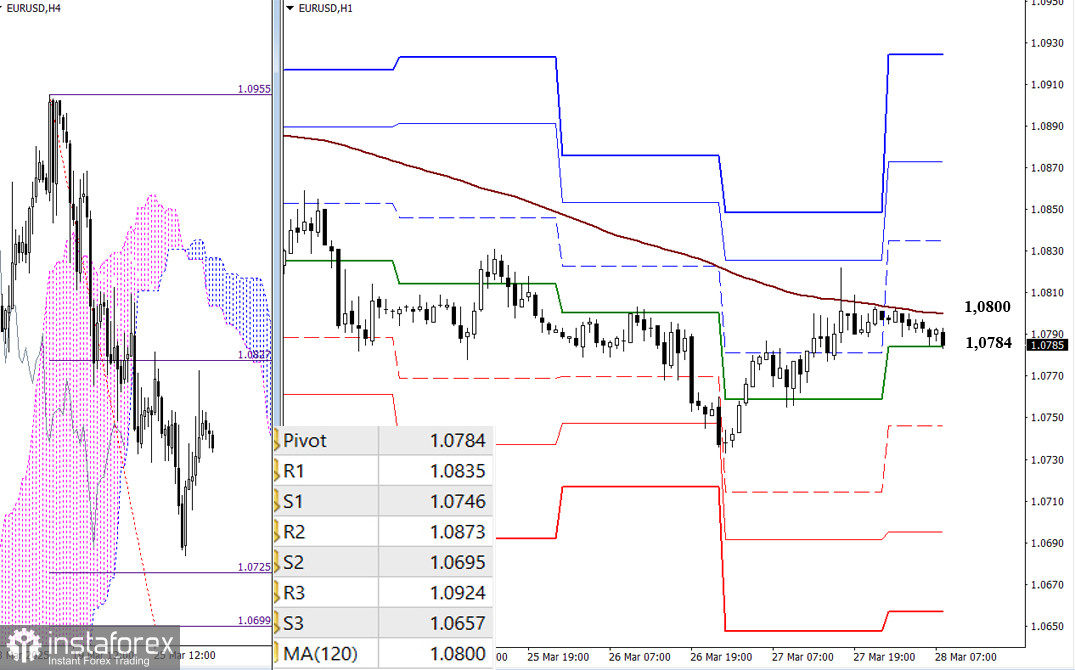
On the lower timeframes, the pair is currently testing the resistance of the weekly long-term trend (1.0800). Holding this level gives a significant advantage. If the bulls manage to consolidate above this level and reverse the trend in their favor, they can test the resistance levels of the classic Pivot Points intraday (1.0835 – 1.0873 – 1.0924). If the trend is not broken, the advantage will remain on the bearish side. If the decline resumes, support will be provided by the classic Pivot Points today at 1.0746 – 1.0695 – 1.0657.

***

GBP/USD

This image is no longer relevant

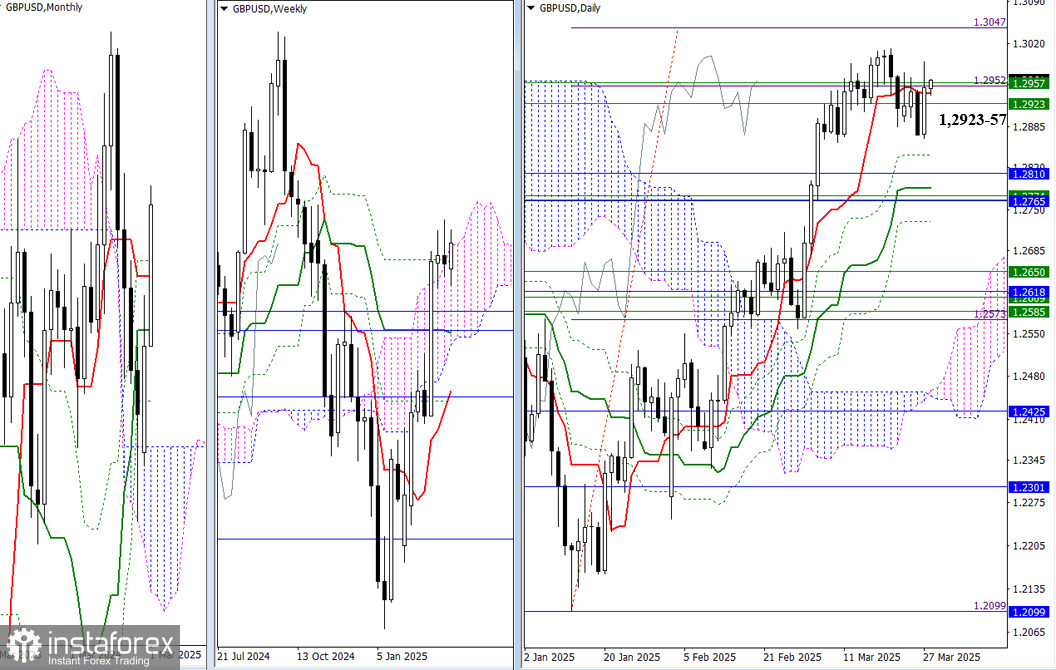
The market remains within a range of uncertainty that has persisted from previous weeks, remaining in the gravitational zone and influence of the weekly levels (1.2923 – 1.2957) and the daily short-term trend (1.2940). The main expectations have not changed, and the key reference points remain in place. The next upside target remains the 100% completion level of the daily breakout target above the Ichimoku cloud (1.3047), while the cluster of levels of interest to the bears is still located around 1.2765–1.2810, where monthly, weekly, and daily supports are gathered.

This image is no longer relevant

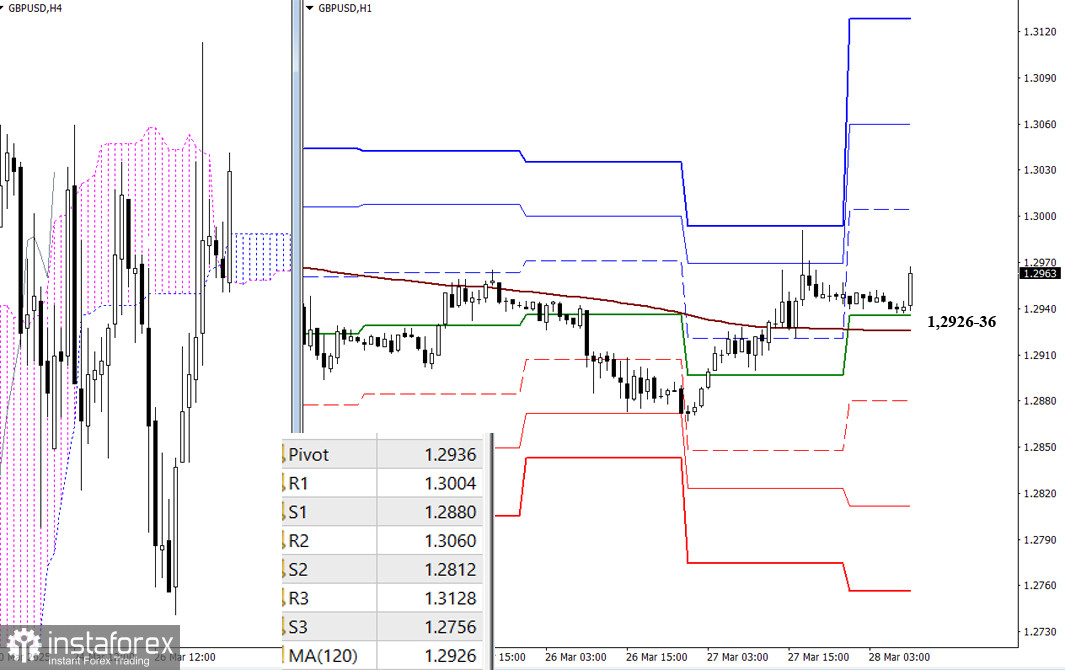
The bulls consolidated above the key levels of 1.2936 (daily central Pivot Point) and 1.2926 (weekly long-term trend), thereby gaining the main advantage on the lower timeframes. Intraday, further upside development today will proceed through the resistance levels of the classic Pivot Points (1.3004 – 1.3060 – 1.3128). A loss of the key levels (1.2936–26) will shift the current balance of power in favor of bearish sentiment. In that case, the market will focus on the support levels of the classic Pivot Points (1.2880 – 1.2812 – 1.2756).

***

Technical Analysis Components:
  • Higher Timeframes: Ichimoku Kinko Hyo (9.26.52) and Fibonacci Kijun levels
  • H1: Classic Pivot Points and 120-period Moving Average (weekly long-term trend)
Evangelos Poulakis,
Analytical expert of InstaTrade
© 2007-2025

Recommended Stories

Forecast for EUR/USD on August 11, 2025

On Friday, EUR/USD made two rebounds from the 1.1637–1.1645 support zone and turned in favor of the euro. This means the upward movement could continue today toward the 76.4% Fibonacci

Samir Klishi 10:44 2025-08-11 UTC+2

Forecast for GBP/USD on August 11, 2025

On the hourly chart, GBP/USD on Friday made two rebounds from the 1.3425 level, and on Monday continues moving upward toward the 76.4% retracement level at 1.3470. A rebound from

Samir Klishi 10:25 2025-08-11 UTC+2

Forex forecast 11/08/2025: EUR/USD, USD/JPY, GBP/USD, Gold, Ethereum and Bitcoin

Useful links: My other articles are available in this section InstaForex course for beginners Popular Analytics Open trading account Important: The begginers in forex trading need to be very careful

Sebastian Seliga 10:20 2025-08-11 UTC+2

GBP/USD. Technical Analysis for the Week of August 11–16

Trend Analysis This week, from the 1.3450 level (close to the last weekly candle), the price may start moving downward toward 1.3270 – a historical support level (blue dotted line)

Stefan Doll 10:02 2025-08-11 UTC+2

EUR/USD. Technical Analysis for the Week of August 11–16

Last week, the pair moved upward, almost testing the historical resistance level at 1.1710 (blue dotted line), and then turned downward, closing the weekly candle at 1.1641. In the coming

Stefan Doll 09:55 2025-08-11 UTC+2

GBP/USD. Indicator Analysis on August 11, 2025

On Friday, the pair moved downward, tested the 61.8% retracement level at 1.3416 (red dotted line), and then rose, closing the daily candle at 1.3450. Today, the price will attempt

Stefan Doll 09:53 2025-08-11 UTC+2

EUR/USD. Indicator Analysis on August 11, 2025

On Friday, the pair moved downward, almost testing the 23.6% retracement level at 1.1626 (blue dotted line), after which the price rose slightly and closed the daily candle at 1.1641

Stefan Doll 09:40 2025-08-11 UTC+2

If the USD/JPY successfully breaks through the Pivot level, it has the potential to continue strengthening. Monday, August 11, 2025.

[USD/JPY] – [Monday, August 11, 2025] Although the condition of USD/JPY is still moving sideways, as indicated by the overlapping EMAs, the USD/JPY's successful breakout and close above its Pivot

Arief Makmur 07:37 2025-08-11 UTC+2

NZD/USD still has the opportunity to continue strengthening to its nearest resistance level. Monday, August 11, 2025.

[NZD/USD] – [Monday, August 11, 2025] With both EMAs forming a Golden Cross and the RSI(14) indicator at the Neutral Bullish level, the Kiwi has the potential to strengthen today

Arief Makmur 07:37 2025-08-11 UTC+2

EUR/USD Forecast for August 11, 2025

The euro has settled even more firmly at the 1.1632 support level. The longer it consolidates there, the more balanced the probabilities of growth and decline will become. However

Laurie Bailey 05:01 2025-08-11 UTC+2
Can't speak right now?
Ask your question in the chat.
 

Dear visitor,

Your IP address shows that you are currently located in the USA. If you are a resident of the United States, you are prohibited from using the services of InstaFintech Group including online trading, online transfers, deposit/withdrawal of funds, etc.

If you think you are seeing this message by mistake and your location is not the US, kindly proceed to the website. Otherwise, you must leave the website in order to comply with government restrictions.

Why does your IP address show your location as the USA?

  • - you are using a VPN provided by a hosting company based in the United States;
  • - your IP does not have proper WHOIS records;
  • - an error occurred in the WHOIS geolocation database.

Please confirm whether you are a US resident or not by clicking the relevant button below. If you choose the wrong option, being a US resident, you will not be able to open an account with InstaTrade anyway.

We are sorry for any inconvenience caused by this message.