See also

 28.03.2025 07:05 AM
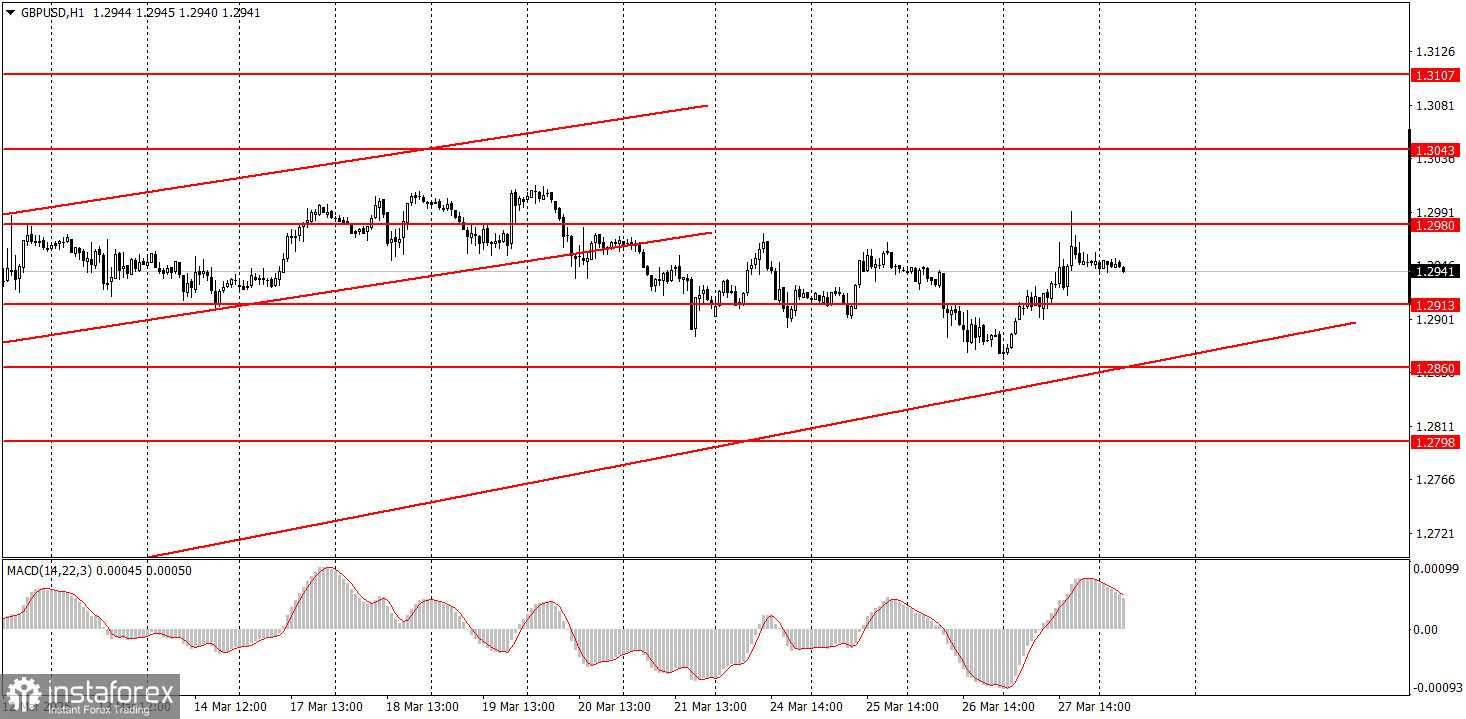
On Thursday, the GBP/USD pair also traded higher—and quite strongly. Despite the release of a reasonably solid Q4 GDP report in the U.S., it did little to ease the pressure on the dollar. The reason was that overnight, Donald Trump announced new import tariffs on all countries exporting automobiles to the United States. As a result, the British pound still hasn't begun its anticipated decline, and the upward trend remains intact, as indicated by the trendline. The macroeconomic backdrop continues to be a secondary consideration for traders. The key reasons for the pound's recent resilience are Trump's tariffs and the Bank of England's relatively hawkish stance. If you look closely, a sideways range has formed in recent weeks. The dollar fell yesterday; it might rise today.
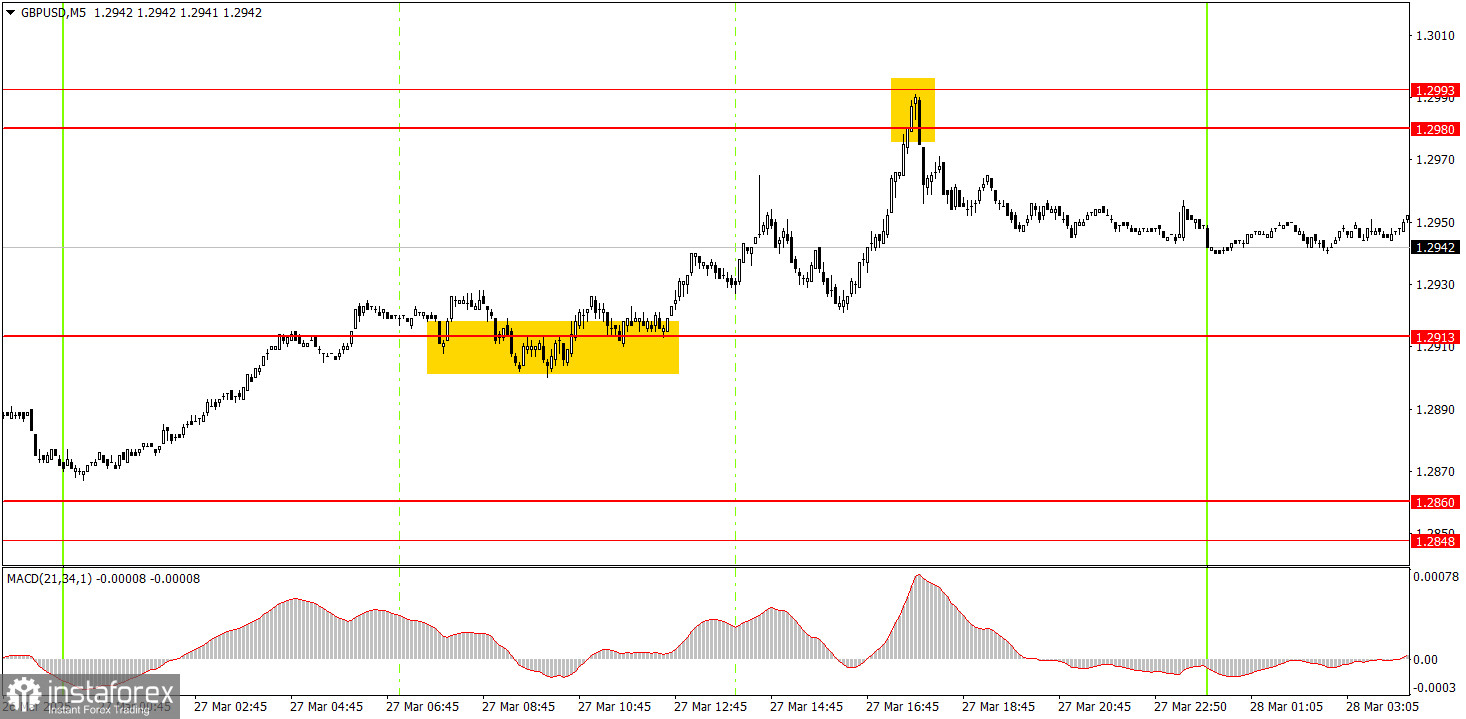
On the 5-minute chart Thursday, two somewhat imprecise signals were formed. The upward move had already begun overnight for apparent reasons and continued throughout the day. Unfortunately, the first buy signal appeared only near the 1.2913 level after the price had risen by 50 pips. The signal itself was unusually inaccurate. However, the rebound from the 1.2980–1.2993 area was excellent. This was a sell signal after a 120-pip rise in the pair. It was tradeable and potentially profitable.
On the 1-hour chart, the GBP/USD pair should have started a downtrend long ago, but Trump is doing everything to prevent that from happening. We still expect the pound to fall toward 1.1800 in the medium term. However, it is uncertain how long the decline of the dollar, influenced by Trump's policies, will last. Once this movement ends, the technical picture across all timeframes could change dramatically, but long-term trends still point south. The British pound hasn't been rising without cause—but again, its rise appears excessive and illogical.
On Friday, the GBP/USD pair may resume its decline, although it's more accurate to say it may continue to trade sideways. The rebound from the 1.2980–1.2993 area already points to a likely drop, and today's macroeconomic background is not expected to be particularly strong.
On the 5-minute chart, trading can focus on the following levels: 1.2301, 1.2372–1.2387, 1.2445, 1.2502–1.2508, 1.2547, 1.2613, 1.2680–1.2685, 1.2723, 1.2791–1.2798, 1.2848–1.2860, 1.2913, 1.2980–1.2993, 1.3043, and 1.3102–1.3107. The UK is scheduled to release Friday's Q4 GDP and retail sales reports. Both reports are not particularly significant at the moment. In the U.S., the data is even less critical, with the PCE index and consumer sentiment index being the most notable, albeit marginally so.
Support and Resistance Levels: These are target levels for opening or closing positions and can also serve as points for placing Take Profit orders.
Red Lines: Channels or trendlines indicating the current trend and the preferred direction for trading.
MACD Indicator (14,22,3): A histogram and signal line used as a supplementary source of trading signals.
Important Events and Reports: Found in the economic calendar, these can heavily influence price movements. Exercise caution or exit the market during their release to avoid sharp reversals.
Forex trading beginners should remember that not every trade will be profitable. Developing a clear strategy and practicing proper money management are essential for long-term trading success.


