empty
10.03.2025 12:47 AM
NDX – Weekly Results and Prospects

This image is no longer relevant

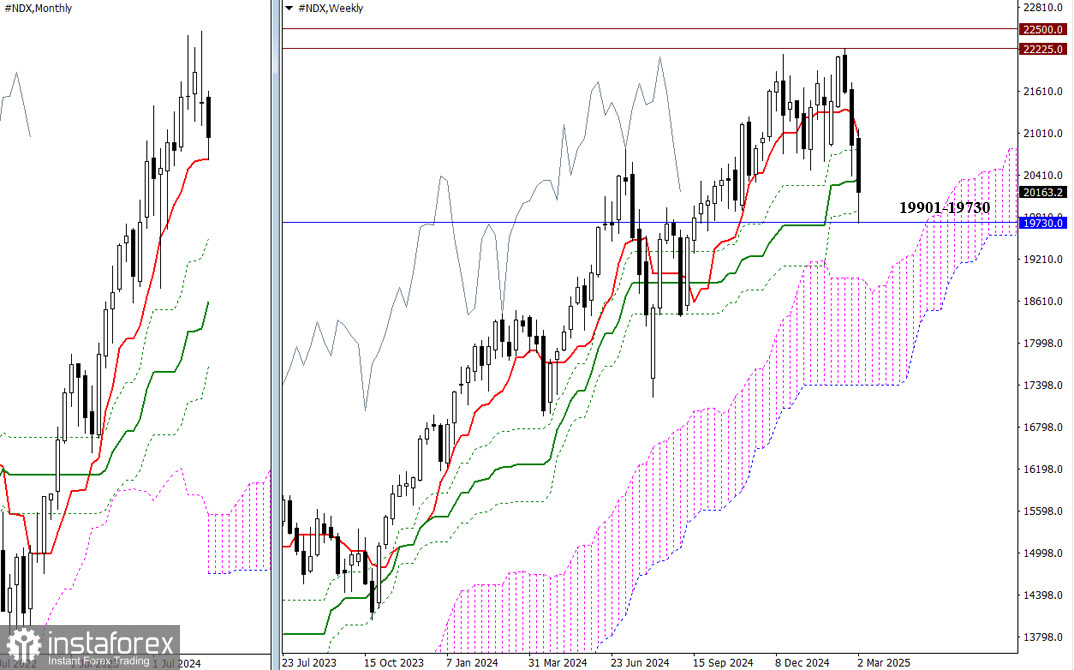
March is developing a corrective bearish decline. Over the past trading week, two key levels—19901 and 19730—were tested, which correspond to the final level of the weekly Ichimoku cross and the monthly short-term trend. A breakout of these levels could open up further downside potential for sellers, with the next major support located around 18891, marking the upper boundary of the weekly Ichimoku cloud. If the market rebounds, it might lead to a retest of the previously broken weekly golden cross levels at 20345, 20789, and 20973.

This image is no longer relevant

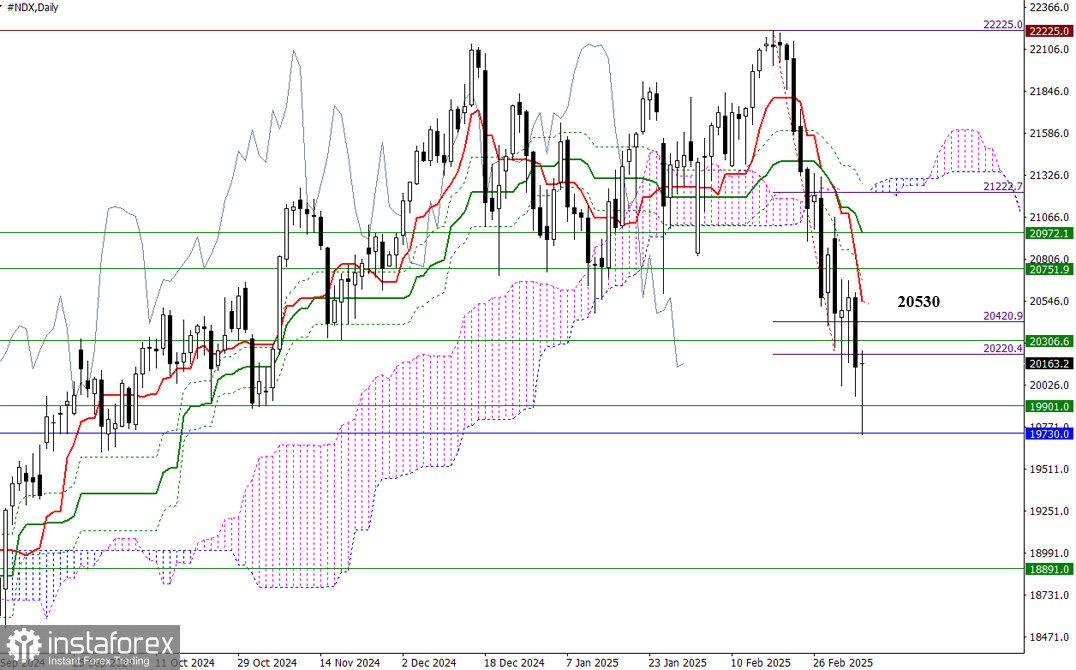
On the daily timeframe, the target for breaking through the daily Ichimoku cloud at 20220 has been fully achieved. A rebound has already started after testing deeper supports at 19901 and 19730. If buyers manage to confirm and extend this rebound, a restoration of bullish positions may involve a corrective rally toward the daily Ichimoku cross levels. The nearest resistance for buyers currently lies at the daily short-term trend around 20530.

This image is no longer relevant

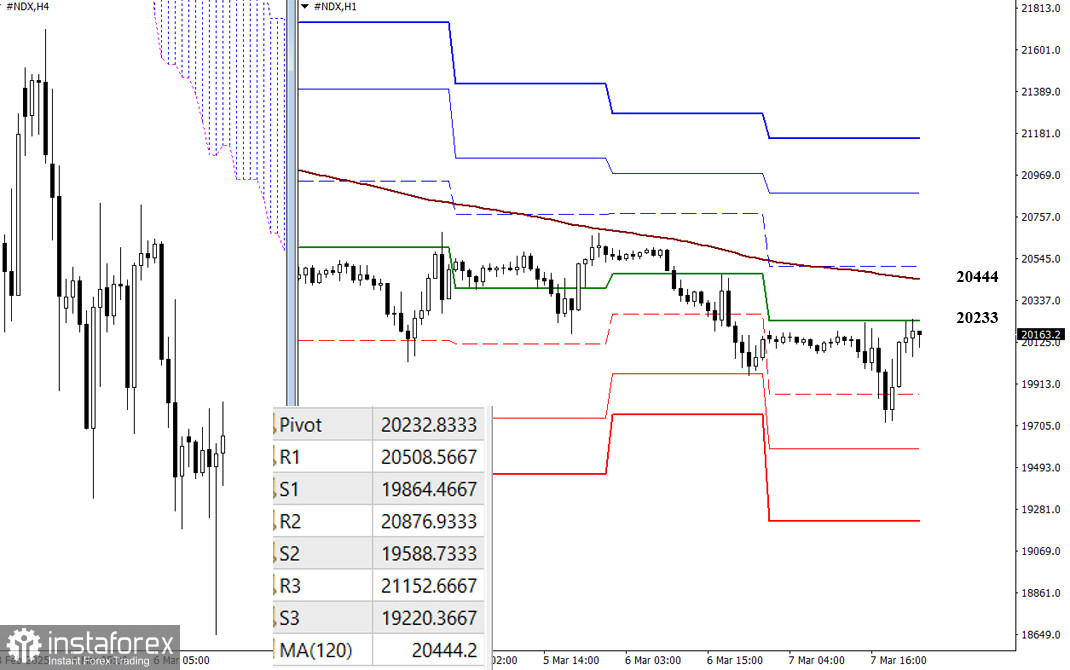
On lower timeframes, sellers maintain a dominant position and continue developing the downward trend. However, during corrective rallies, key levels are repeatedly tested. At this moment, the market is consolidating around the central pivot level of the day at 20233, with the weekly long-term trend resistance just above at 20444. A breakout and trend reversal at these levels could shift the balance of power. As seen on higher timeframes, classic pivot levels act as additional intraday references that update daily, with fresh levels appearing at the market open after the weekend.

***

Technical Analysis Components:
  • Higher Timeframes: Ichimoku Kinko Hyo (9.26.52) and Fibonacci Kijun levels
  • H1: Classic Pivot Points and 120-period Moving Average (weekly long-term trend)
Evangelos Poulakis,
Analytical expert of InstaTrade
© 2007-2025

Recommended Stories

GBP/USD. Analysis and Forecast

Today, the GBP/USD pair is consolidating within the 1.3430–1.3435 level, holding slightly above the three-week low recorded during the Asian session, as markets await the release of U.S. consumer inflation

Irina Yanina 12:18 2025-07-15 UTC+2

Forecast for EUR/USD on July 15, 2025

On Monday, the EUR/USD pair traded sideways, and overall market activity was very low. Thus, despite the prevailing bearish sentiment, bears failed to push the pair lower. A rebound from

Samir Klishi 11:46 2025-07-15 UTC+2

Forecast for GBP/USD on July 15, 2025

On the hourly chart, the GBP/USD pair continued to decline on Monday and by the end of the day had reached the support zone of 1.3425–1.3444. A rebound from this

Samir Klishi 11:30 2025-07-15 UTC+2

Despite the potential for a correction to its nearest support level, USD/CHF still has the potential to return to its bullish bias on Tuesday, July 15, 2025.

USD/CHF - Tuesday, July 15, 2025. With the Golden Cross condition between EMA(50) and EMA(200) indicates that buyers still dominate, although there is potential for a correction in the near

Arief Makmur 07:31 2025-07-15 UTC+2

If the Fiber strengthening is held at its Resistance 1 level, EUR/USD has the potential to weaken again on Tuesday, July 15, 2025.

EUR/USD - Tuesday, July 15, 2025. Although the RSI(14) is at 55.39 (Neutral-Bullish), the EMA(50) is below the EMA(200), indicating that despite the upward retracement, the potential for a continued

Arief Makmur 07:31 2025-07-15 UTC+2

EUR/USD Forecast for July 15, 2025

On the daily chart, the price has consolidated below the 1.1692 level. The Marlin oscillator is currently entering the territory of a downward trend. The target at 1.1535

Laurie Bailey 05:12 2025-07-15 UTC+2

GBP/USD Forecast for July 15, 2025

By the end of Monday, the British pound consolidated below the balance indicator line, having approached the target support level at 1.3369 by 65 points. The signal line

Laurie Bailey 05:12 2025-07-15 UTC+2

USD/JPY Forecast for July 15, 2025

Following a rebound from the support level at 146.11, the USD/JPY pair has reached the upper line of the wedge pattern on the daily chart and is now targeting

Laurie Bailey 05:12 2025-07-15 UTC+2

USD/JPY. Analysis and Forecast

The USD/JPY pair remains in a consolidation phase near a three-week high, supported by U.S. dollar strength and mixed market signals. The dollar is being bolstered by U.S. President Donald

Irina Yanina 12:17 2025-07-14 UTC+2

Technical Analysis for the Week of July 14–19: GBP/USD Currency Pair

Last week, the pair moved downward and broke below the 8-period EMA at 1.3509 (thin blue line), closing the weekly candle at 1.3487. In the upcoming week, the price

Stefan Doll 11:40 2025-07-14 UTC+2
Can't speak right now?
Ask your question in the chat.
 

Dear visitor,

Your IP address shows that you are currently located in the USA. If you are a resident of the United States, you are prohibited from using the services of InstaFintech Group including online trading, online transfers, deposit/withdrawal of funds, etc.

If you think you are seeing this message by mistake and your location is not the US, kindly proceed to the website. Otherwise, you must leave the website in order to comply with government restrictions.

Why does your IP address show your location as the USA?

  • - you are using a VPN provided by a hosting company based in the United States;
  • - your IP does not have proper WHOIS records;
  • - an error occurred in the WHOIS geolocation database.

Please confirm whether you are a US resident or not by clicking the relevant button below. If you choose the wrong option, being a US resident, you will not be able to open an account with InstaTrade anyway.

We are sorry for any inconvenience caused by this message.