See also
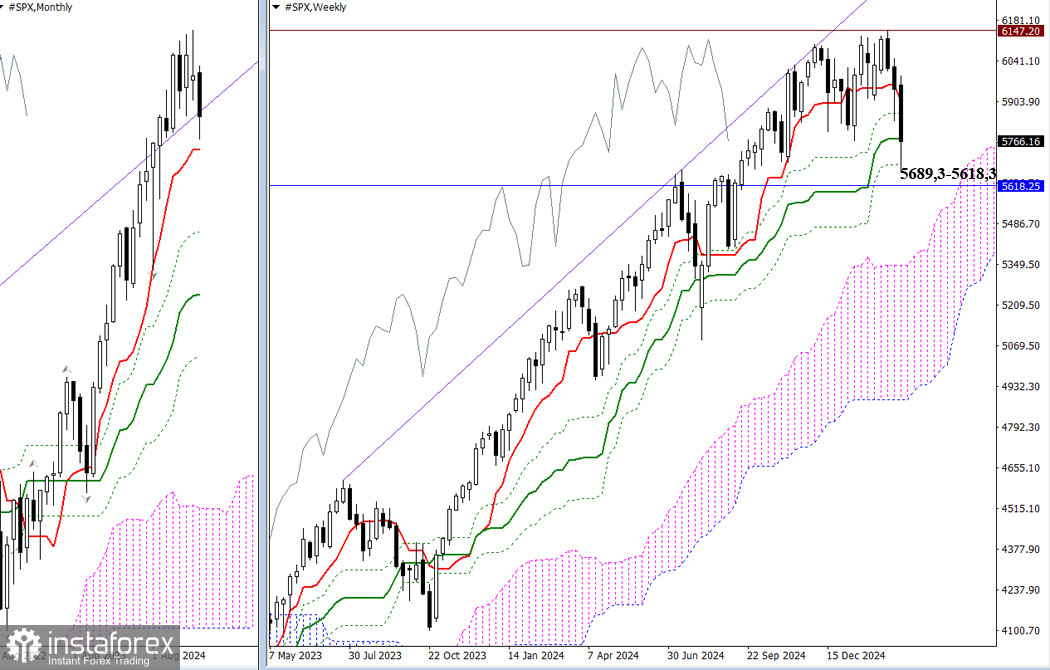
February's uncertainty has transitioned into a bearish correction in early March. Sellers are currently trying to break through the weekly golden cross at 5689.3 and test the monthly short-term trend at 5618.3. A solid consolidation below the nearest support zone (ranging from 5689.3 to 5618.3) could create new opportunities for bearish traders.
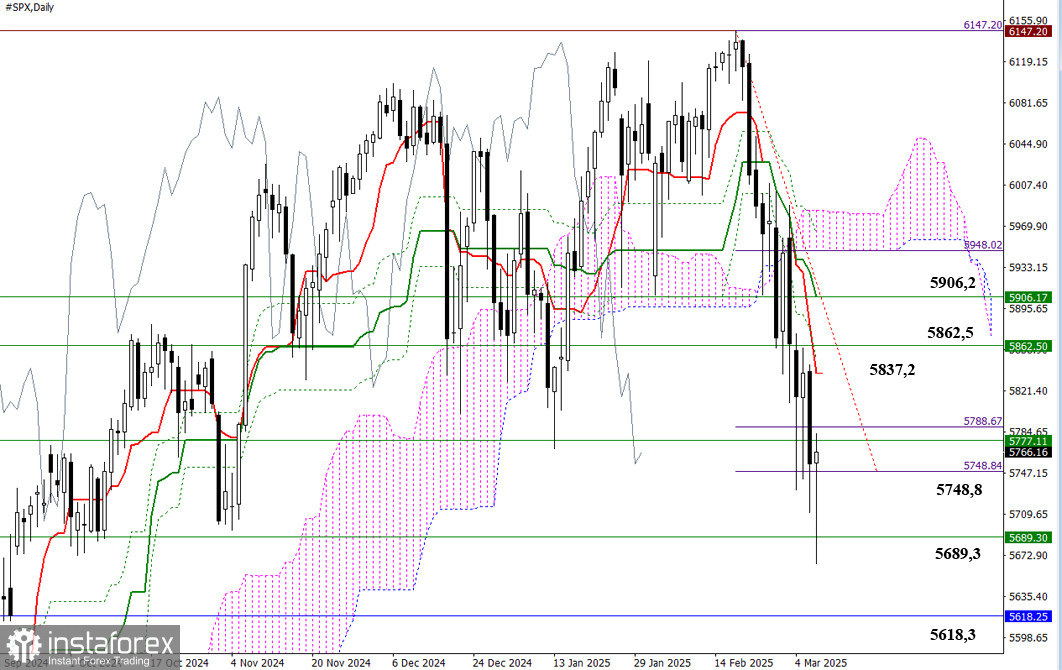
Alongside testing the supports of the weekly cross, the daily timeframe has also reached its target for breaking through the Ichimoku cloud at 5748.8. The current slowdown may lead to a retest of previously broken weekly levels, potentially triggering a daily corrective rally. The nearest reference point for this rally is the daily short-term trend at 5837.2.
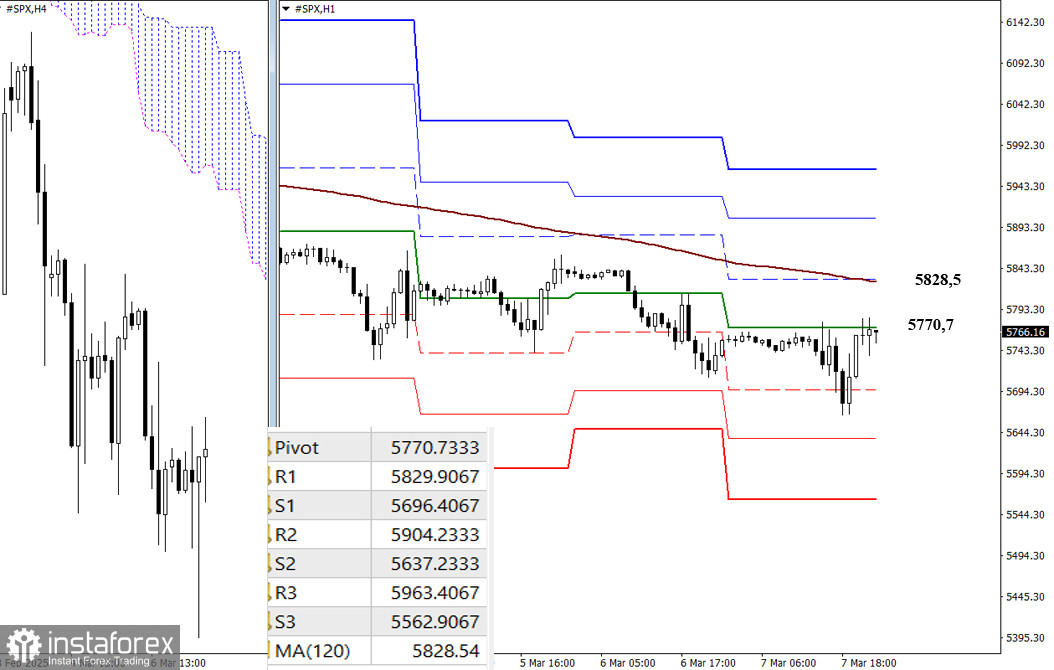
On lower timeframes, a consistent decline has formed a downward trend over the past few days. During corrective rallies, buyers have primarily been limited to testing the daily central pivot level, with the latest test occurring around 5770.7. A correction extending toward the weekly long-term trend at 5828.5 could raise concerns about a shift in the current balance of power, as holding this trend is crucial for maintaining an advantage. Additional intraday reference points include the classic pivot levels, which are updated daily, with new data emerging at the market open.
***
You have already liked this post today
*The market analysis posted here is meant to increase your awareness, but not to give instructions to make a trade.
USD/CHF, Thursday, July 10, 2025 In addition to rumors of a planned Fed interest rate cut and falling US government bond yields, USD/CHF weakened today. Key Levels 1. Resistance
GBP/USD, Thursday, July 10, 2025. Rumors of the Fed's future dovish policy have created negative sentiment towards the USD, potentially helping the pound sterling strengthen again today. Key Levels
If the bullish momentum prevails, we should buy gold above the 200 EMA located at 3,324. The outlook could be positive, with the price reaching 3,450 in the short term
Early in the American session, gold is trading around $3,309, rebounding after reaching the bottom of the downtrend channel formed on June 30, around $3,281. This area represents good support
The NZD/USD pair is currently trading above the psychological level of 0.6000; however, it remains vulnerable to further downside amid broad-based U.S. dollar strength. The U.S. Dollar Index is supported
Your IP address shows that you are currently located in the USA. If you are a resident of the United States, you are prohibited from using the services of InstaFintech Group including online trading, online transfers, deposit/withdrawal of funds, etc.
If you think you are seeing this message by mistake and your location is not the US, kindly proceed to the website. Otherwise, you must leave the website in order to comply with government restrictions.
Why does your IP address show your location as the USA?
Please confirm whether you are a US resident or not by clicking the relevant button below. If you choose the wrong option, being a US resident, you will not be able to open an account with InstaTrade anyway.
We are sorry for any inconvenience caused by this message.