empty
24.02.2025 01:34 AM
NDX – Weekly Results and Future Outlook

This image is no longer relevant

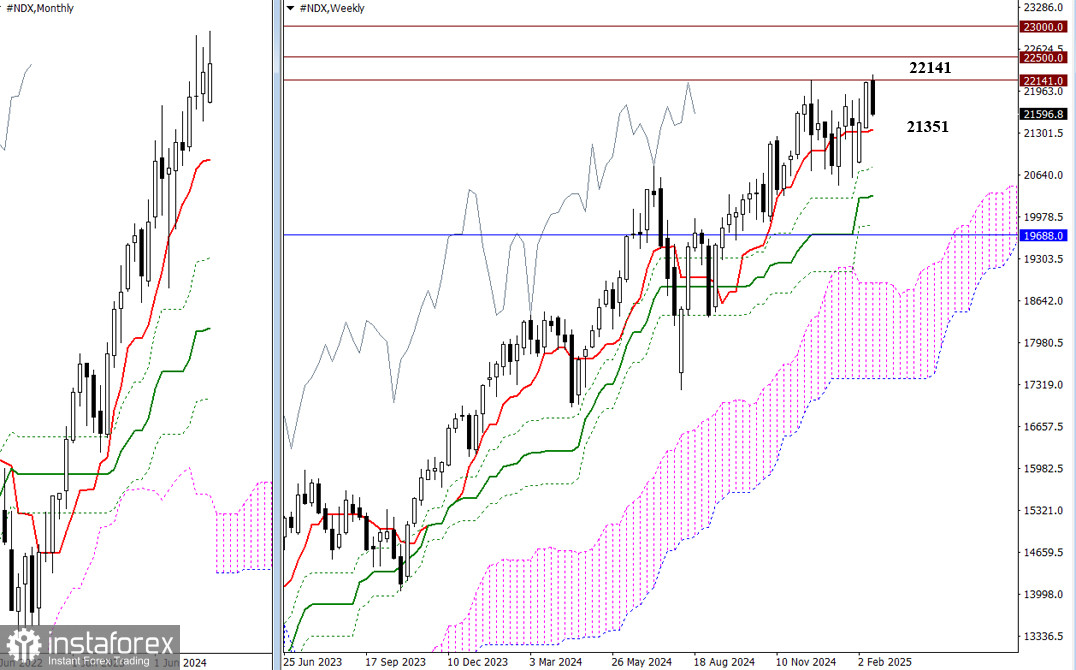
On February 18, a new maximum extreme (22,225) was reached, but the bears took control, resulting in a significant decline by the end of the trading week. Bearish players reclaimed most of the gains achieved by the bulls the day before. If they manage to hold their positions and continue the decline, the subsequent test of the nearest support level at the short-term weekly trend (21,351) may end with a breakout of the Tenkan line and further interact with other levels of the weekly cross.

This image is no longer relevant

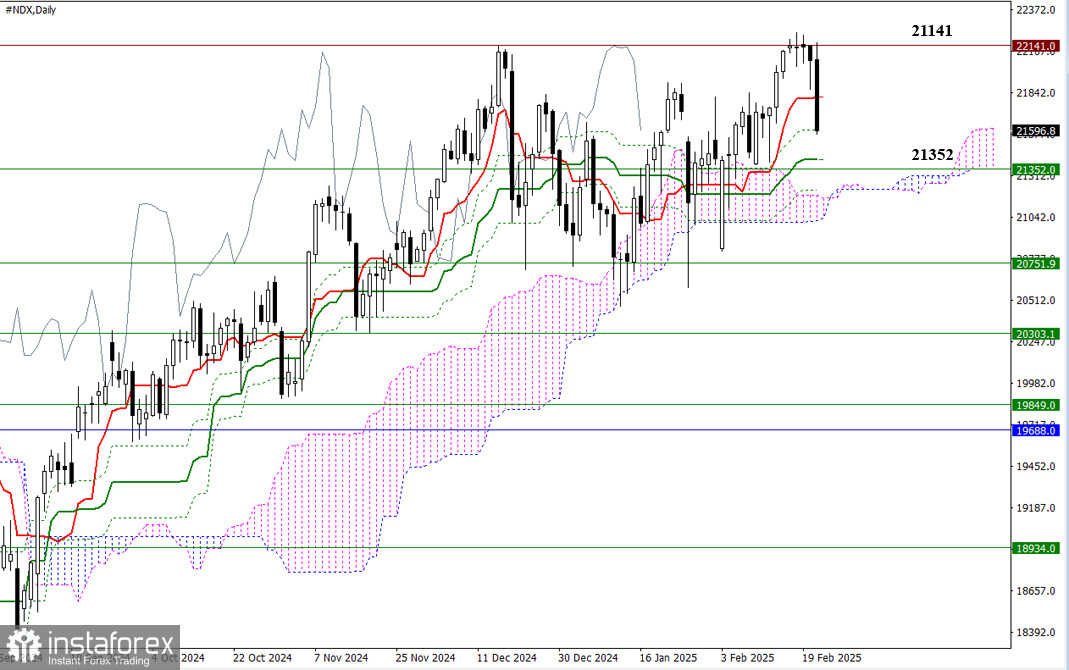
By the end of the trading week, a rebound from the record high (22,141) allowed the market to fall to the support of the daily Fibonacci Kijun (21,604). If bearish sentiment continues to strengthen in the near term, the next tasks will be to eliminate the daily Ichimoku golden cross (21,412 – 21,220), return to the bears' side of the short-term weekly trend (21,352), and break the daily cloud (21,170). However, if bullish players seek a comeback and manage to stop the current decline, they will need to consolidate above the previous week's maximum extreme (22,225) to restore the uptrend on higher timeframes.

This image is no longer relevant

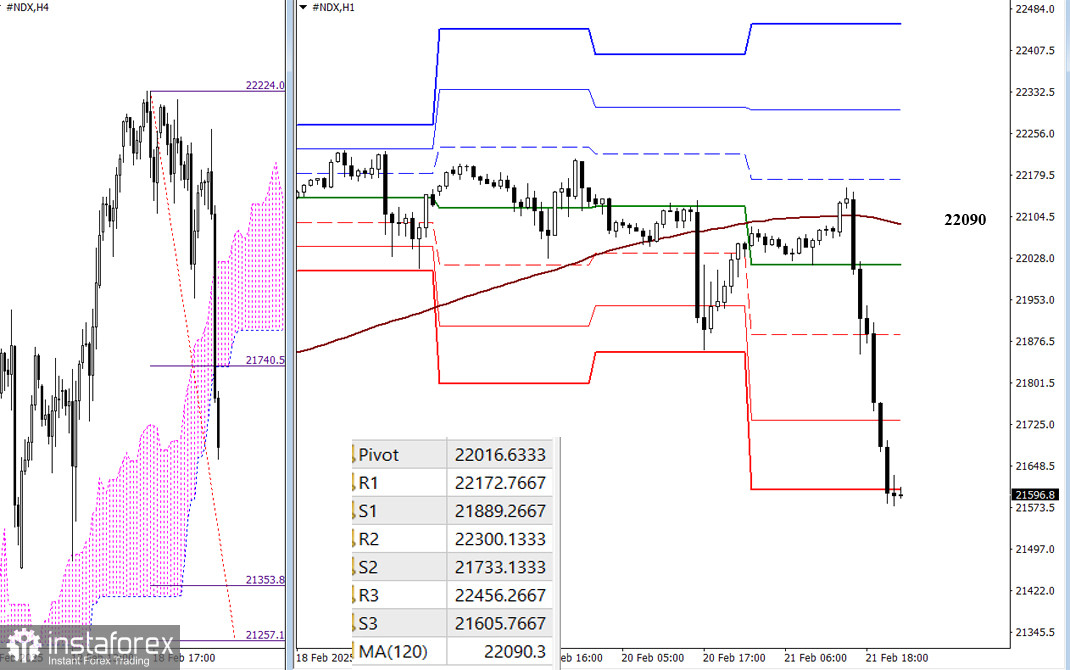
On lower timeframes, bearish players currently hold the main advantage. On H4, a target for a break of the H4 Ichimoku cloud (21,354 – 21,257) has been set for them. Additional intraday downside reference points include the supports of the classic Pivot levels, with updated Pivot values to be revealed at the market open. For the balance of power to shift, bulls must reclaim the key levels – the central Pivot level of the day and the long-term weekly trend (22,090).

***

Technical Analysis Components:
  • Higher Timeframes: Ichimoku Kinko Hyo (9.26.52) and Fibonacci Kijun levels
  • H1: Classic Pivot Points and 120-period Moving Average (weekly long-term trend)
Evangelos Poulakis,
Analytical expert of InstaTrade
© 2007-2025

Recommended Stories

Forex forecast 16/07/2025: EUR/USD, GBP/USD, USDX, Gold and Ethereum

Useful links: My other articles are available in this section InstaForex course for beginners Popular Analytics Open trading account Important: The begginers in forex trading need to be very careful

Sebastian Seliga 14:00 2025-07-16 UTC+2

USD/JPY. Analysis and Forecast

From a technical standpoint, yesterday's breakout above the key psychological level of 148.00—also the June high—and the subsequent move above the May high around 148.65 can be seen

Irina Yanina 13:05 2025-07-16 UTC+2

Forecast for EUR/USD on July 16, 2025

On Tuesday, the EUR/USD pair continued its decline, dropping sharply by 85 points. A firm close below the 1.1645 level allows us to expect a further fall toward the next

Samir Klishi 12:22 2025-07-16 UTC+2

GBP/USD. July 16th. Inflation in the UK Continues to Rise

On the hourly chart, the GBP/USD pair continued to decline on Tuesday toward the 100.0% retracement level at 1.3371. A rebound from this level or a consolidation above 1.3425 will

Samir Klishi 12:12 2025-07-16 UTC+2

AUD/USD has the potential to continue its decline to the Support level. 1, Wednesday, July 16, 2025.

AUD/USD - Wednesday, July 17, 2025. Sellers are currently dominant in the AUD/USD commodity currency pair, as indicated by a Death Cross on the 50-day moving average (EMA) below

Arief Makmur 07:53 2025-07-16 UTC+2

Although USD/JPY has the potential to correct to its Pivot Point level, it still has the potential to strengthen again on Wednesday, July 16, 2025.

USD/JPY – Wednesday, July 17, 2025. Although there is a divergence between the RSI(14) indicator and the USD/JPY price movement, with the 50 EMA still forming a Golden Cross above

Arief Makmur 07:53 2025-07-16 UTC+2

Trading Signals for EUR/USD for July 17-20, 2025: buy above 1.1596 (200 EMA - 7/8 Murray)

If the euro sharply breaks out of the uptrend channel and consolidates above 1.1700, the outlook for the euro could be positive. Thus, we would expect a recovery that could

Dimitrios Zappas 07:08 2025-07-16 UTC+2

Trading Signals for GOLD (XAU/USD) for July 17-20, 2025: buy above $3,300 (21 SMA - 5/8 Murray)

The eagle indicator is showing a positive signal. However, there is bearish pressure, so we must be cautious, as gold could continue its fall in the coming days. A technical

Dimitrios Zappas 07:05 2025-07-16 UTC+2

EUR/USD Forecast for July 16, 2025

Yesterday's U.S. inflation data strengthened the dollar (U6 index) by 0.56%. The CPI for June rose from 2.4% y/y to 2.7% y/y, while core CPI came in at 2.9% y/y

Laurie Bailey 06:11 2025-07-16 UTC+2

GBP/USD Forecast for July 16, 2025

On Tuesday, the British pound declined by 42 points and nearly reached the target support level at 1.3369. Today, the UK will release June inflation data. Both the core

Laurie Bailey 06:11 2025-07-16 UTC+2
Can't speak right now?
Ask your question in the chat.
 

Dear visitor,

Your IP address shows that you are currently located in the USA. If you are a resident of the United States, you are prohibited from using the services of InstaFintech Group including online trading, online transfers, deposit/withdrawal of funds, etc.

If you think you are seeing this message by mistake and your location is not the US, kindly proceed to the website. Otherwise, you must leave the website in order to comply with government restrictions.

Why does your IP address show your location as the USA?

  • - you are using a VPN provided by a hosting company based in the United States;
  • - your IP does not have proper WHOIS records;
  • - an error occurred in the WHOIS geolocation database.

Please confirm whether you are a US resident or not by clicking the relevant button below. If you choose the wrong option, being a US resident, you will not be able to open an account with InstaTrade anyway.

We are sorry for any inconvenience caused by this message.