empty
22.01.2025 08:45 AM
Stock Indices Are Not Rising Because of Trump

This image is no longer relevant

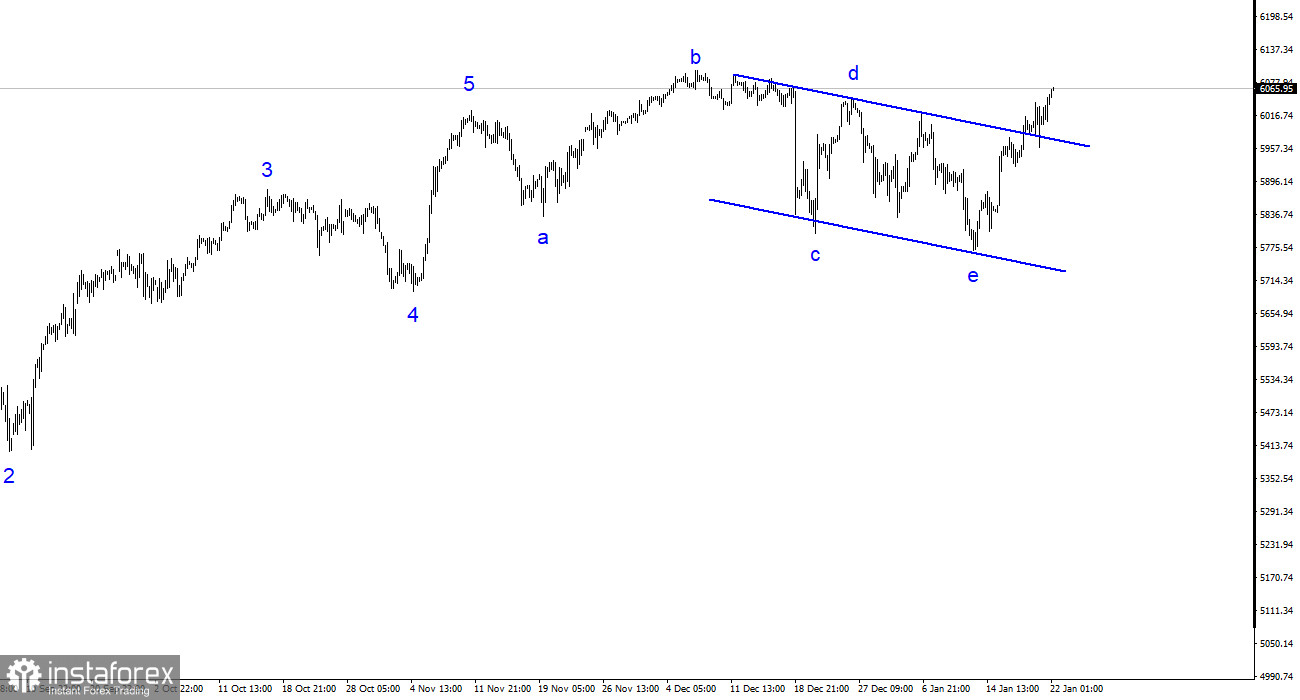
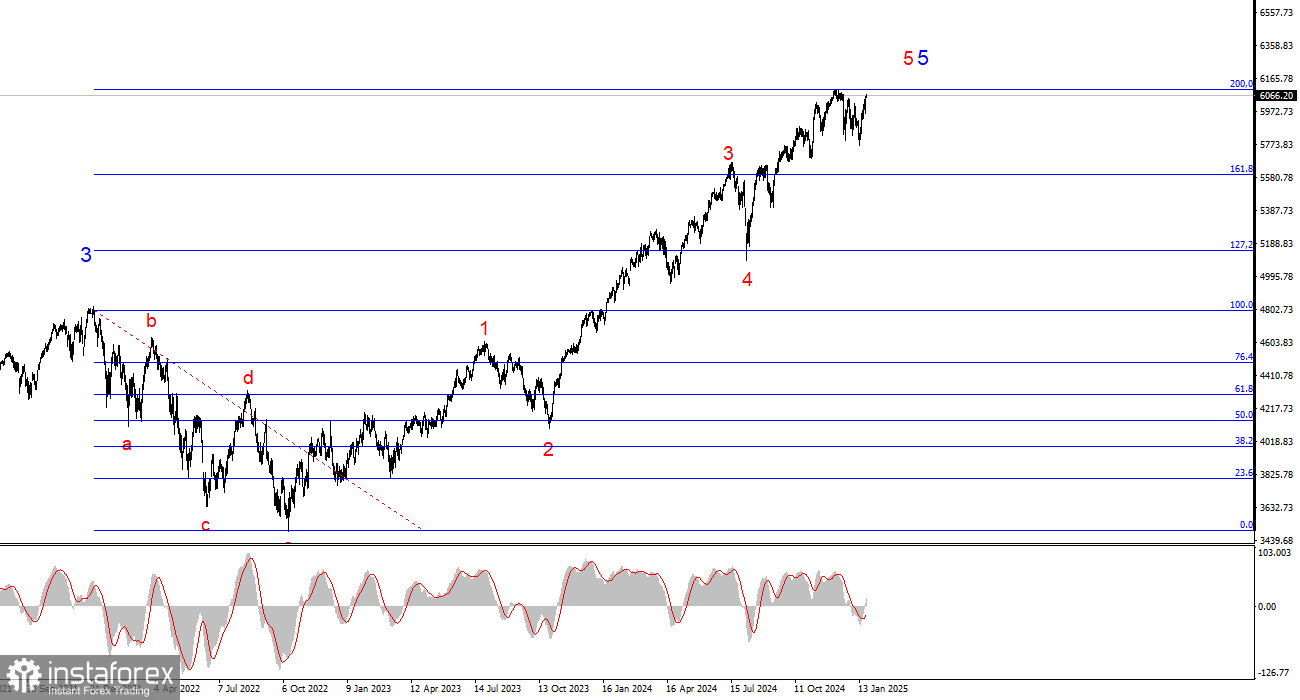
The wave analysis of the 4-hour chart for #SPX is somewhat unclear, and I recommend examining it alongside the wave analysis on the 24-hour chart (see image below). The first noticeable feature on the 24-hour chart is the global five-wave structure, which is so extensive that it doesn't fit within the terminal window, even at the smallest scale. In simpler terms, U.S. stock indexes have been rising for a prolonged period. As we know, trends do change. Currently, we are still in the construction of wave 5 within wave 5. Recently, the instrument failed to break through the 6093 mark, which corresponds to 200.0% on the Fibonacci scale, but this did not result in a significant pullback from the highs that were achieved.

By switching to the 4-hour chart (as shown in the image above), we can see a completed five-wave structure followed by a complex corrective pattern. It's important to note that wave structures should be clear and obvious to avoid ambiguity. The more complicated the wave structure, the more challenging it becomes to trade profitably. If the recent decline is interpreted as a "bullish flag," the S&P 500 index could continue its upward movement, with nearest targets set at 6124 and 6221.

The Stock Market Fears Trump but Ignores Him

The S&P 500 index rose by 41 points on Tuesday. While I wouldn't classify this as a strong growth, the index has been growing exactly like this for the past two years—incrementally, almost daily. Based on this trend, I believe that Trump neither contributed to nor will support American companies. In other words, the U.S. stock market began its upward trajectory before Trump's presidency, and its performance largely relies on the Federal Reserve's monetary policy. Certainly, some decisions made by Trump could negatively affect investors' willingness to invest in U.S. companies. However, so far, he has not made any significant economic decisions; his focus has been on issues like immigration, the World Health Organization, NATO, and ending global conflicts. At 78 years old, Trump seems determined to leave a lasting legacy and be remembered as a leader who makes a difference. As a result, there's nothing particularly concerning for American investors and companies at this time.

Under Trump's administration, there is a possibility that major stock indices could experience a prolonged correction. This potential outcome is supported by wave analysis and the expectation that the Fed's monetary easing will be minimal over the next year. The last wave of growth in the S&P 500 occurred when the market anticipated a shift in FOMC policy. Although the easing began last September, the index has continued to climb. Given this context, I have reservations about sustained growth, even if there is a breakout from the "bullish flag."

This image is no longer relevant

General Conclusions

Based on my analysis of the S&P 500 (#SPX), I conclude that the index continues to build on its upward trend. There are no convincing signs that this trend is nearing completion. The wave analysis from recent months has been complex and ambiguous. I recommend paying attention to the "bullish flag" pattern and considering the impact of Trump's policies. If his initiatives are less beneficial for American companies—such as trade wars, tariffs, import duties, and retaliatory tariffs against the U.S.—it could increase the likelihood of a new downward trend segment.

On a higher scale, the wave structure is much clearer, showing a distinct five-wave pattern with a further five-wave structure within the fifth wave. This fifth wave may be nearing its end, potentially signaling the onset of a prolonged and complex correction, which might have already begun.

Key Principles of My Analysis

  1. Wave structures should be simple and clear. Complex structures are challenging to trade and often subject to change.
  2. If market conditions are unclear, it is better to stay out.
  3. There is never 100% certainty in market direction. Always use Stop Loss orders.
  4. Wave analysis can and should be combined with other analytical methods and trading strategies.
Chin Zhao,
Analytical expert of InstaTrade
© 2007-2025

Recommended Stories

Update on US stock market on July 22. SP500 and NASDAQ sharply down

US stock indices closed mixed yesterday. The S&P 500 rose by 0.14%, and the Nasdaq 100 gained 0.38%. However, the industrial Dow Jones dipped by 0.04%. Today, Asian stocks declined

Jakub Novak 09:54 2025-07-22 UTC+2

High-profile elections in Japan and three important signals for traders

Markets are once again in a state of turbulence. The Japanese yen is fluctuating wildly following the political collapse of Prime Minister Shigeru Ishiba's coalition, which has deepened uncertainty

Аlena Ivannitskaya 12:43 2025-07-21 UTC+2

US stocks end week higher

S&P 500 Overview for July 21 The US market ended the week with gains Major US indices on Friday: Dow -0.3%, NASDAQ +0%, S&P 500 +0%, S&P 500 at 6,297

Jozef Kovach 09:30 2025-07-21 UTC+2

Update on US stock market on July 18. Investors overwhelmed by optimism. SP500 above 6,300

S&P500 Snapshot of major US stock indexes on Thursday Dow +0.5%, NASDAQ +0.7%, S&P 500 +0.5%, S&P 500 closed at 6,297, trading in a range of 5,900 to 6,400

Jozef Kovach 12:48 2025-07-18 UTC+2

Stock market on July 18: SP500 and NASDAQ continue their rally

As of yesterday, US stock indices closed higher. The S&P 500 rose by 0.54%, while the Nasdaq 100 added 0.75%. The industrial Dow Jones strengthened by 0.52%. Today

Jakub Novak 12:02 2025-07-18 UTC+2

Update on US stock market on July 17: key stock indices consolidating below their highs

S&P500 Snapshot of major US stock indices on Wednesday Dow +0.5%, NASDAQ +0.3%, S&P 500 +0.3%, S&P 500 closed at 6263, trading in a range of 5,900 to 6400

Jozef Kovach 13:03 2025-07-17 UTC+2

Stock market on July 17: SP500 and NASDAQ lifted by Powell speculation

As of yesterday, US stock indices closed higher. The S&P 500 rose by 0.32%, while the Nasdaq 100 added 0.25%. The industrial Dow Jones strengthened by 0.53%. The dollar also

Jakub Novak 12:28 2025-07-17 UTC+2

Update on US stock market on July 16: decline following key reports

S&P500 Snapshot of US major stock indices on Tuesday Dow -1%, NASDAQ +0.2%, S&P 500 -0.4%, S&P 500 closed at 6,243, trading in a range of 5,900 to 6,400

Jozef Kovach 13:11 2025-07-16 UTC+2

Stock market on July 16: SP500 and NASDAQ fell sharply amid new Trump tariffs

As of yesterday, US stock indices closed mixed. The S&P 500 fell by 0.40%, while the Nasdaq 100 gained 0.19%. The industrial Dow Jones dropped sharply by 0.98%. During this

Jakub Novak 10:10 2025-07-16 UTC+2

Update on US stock market on July 15: stock indices got stuck below all-time highs

S&P500 Major stock indices standing tall near all-time highs Snapshot of the key US stock indices on Monday: Dow +0.2%, NASDAQ +0.3%, S&P 500 +0.1%, S&P 500 closed at 6,268

Jozef Kovach 10:38 2025-07-15 UTC+2
Can't speak right now?
Ask your question in the chat.
 

Dear visitor,

Your IP address shows that you are currently located in the USA. If you are a resident of the United States, you are prohibited from using the services of InstaFintech Group including online trading, online transfers, deposit/withdrawal of funds, etc.

If you think you are seeing this message by mistake and your location is not the US, kindly proceed to the website. Otherwise, you must leave the website in order to comply with government restrictions.

Why does your IP address show your location as the USA?

  • - you are using a VPN provided by a hosting company based in the United States;
  • - your IP does not have proper WHOIS records;
  • - an error occurred in the WHOIS geolocation database.

Please confirm whether you are a US resident or not by clicking the relevant button below. If you choose the wrong option, being a US resident, you will not be able to open an account with InstaTrade anyway.

We are sorry for any inconvenience caused by this message.