empty
22.01.2025 03:49 AM
Trading Recommendations and Analysis for GBP/USD on January 22: The Pound Faces Strong Resistance Again

GBP/USD 5-Minute Analysis

This image is no longer relevant

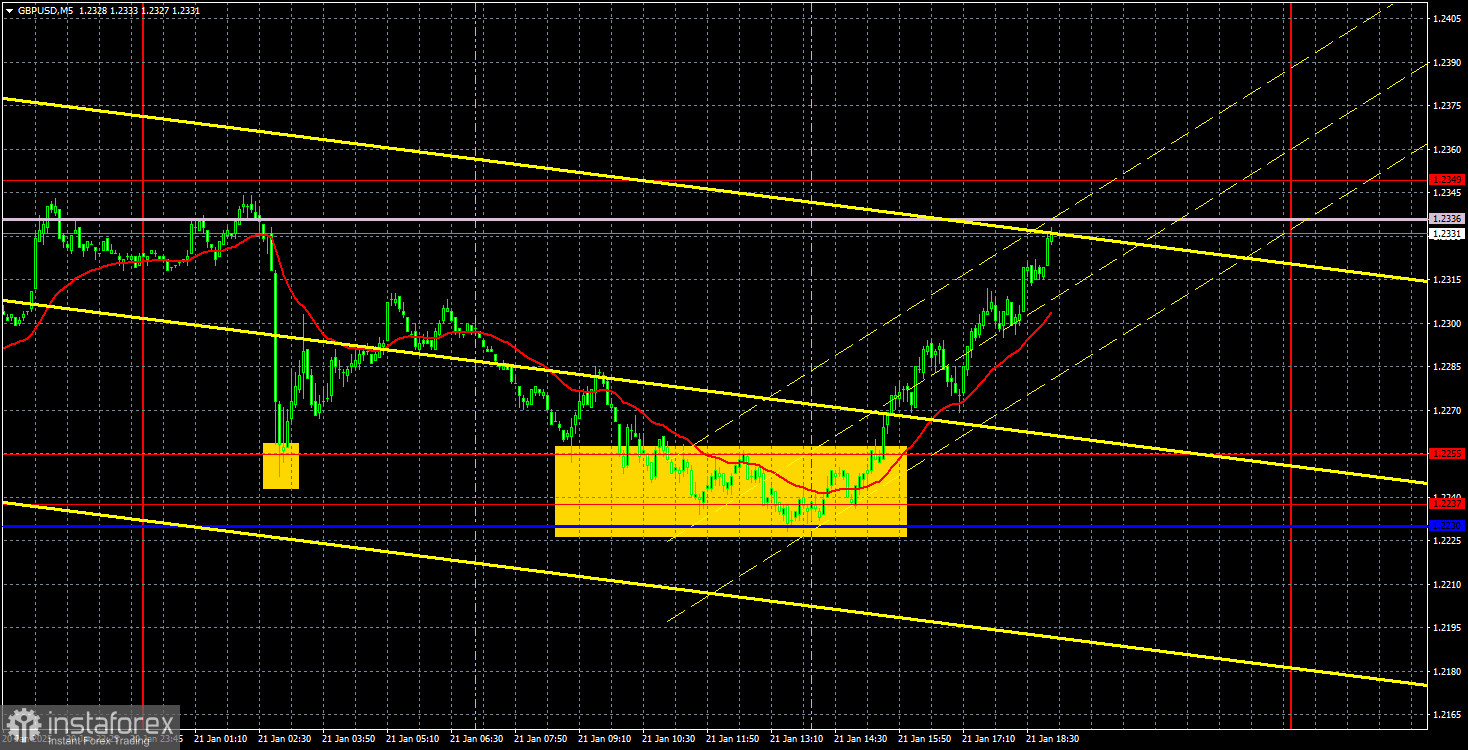
The GBP/USD currency pair experienced a decline followed by a rebound on Tuesday, ending the day near the Senkou Span B line, which serves as a strong resistance level. This makes it challenging for the pound to break through. However, if it manages to surpass this line, it could indicate the continuation of a local upward correction, albeit one that is still considered a correction on higher timeframes. An ascending trendline is supporting the pound's growth, but a price drop below this line would indicate the end of the current trend.

There were no significant macroeconomic factors driving the pound's growth on Tuesday. In the morning, the UK released reports on unemployment, wages, and jobless claims. While not all reports were disappointing, the most crucial one—the unemployment rate—showed negative results. As a result, although the pound was not necessarily expected to decline, it shouldn't have risen either. This aligns with our view that the current upward movement is primarily a technical correction. This correction may continue for some time, and the broader trend can be evaluated on higher timeframes. We maintain that the global and even medium-term downtrend is still not over.

On the 5-minute timeframe, GBP/USD produced two trading signals on Tuesday. Overnight, the price bounced back from the 1.2255 level, increasing by about 40 pips. However, it's unlikely that traders opened positions during the night. Later in the day, there was another rebound from the 1.2237–1.2255 range and the Kijun-sen line, which propelled a rise toward the Senkou Span B line, allowing traders to realize a profit of around 70 pips.

COT Report

This image is no longer relevant

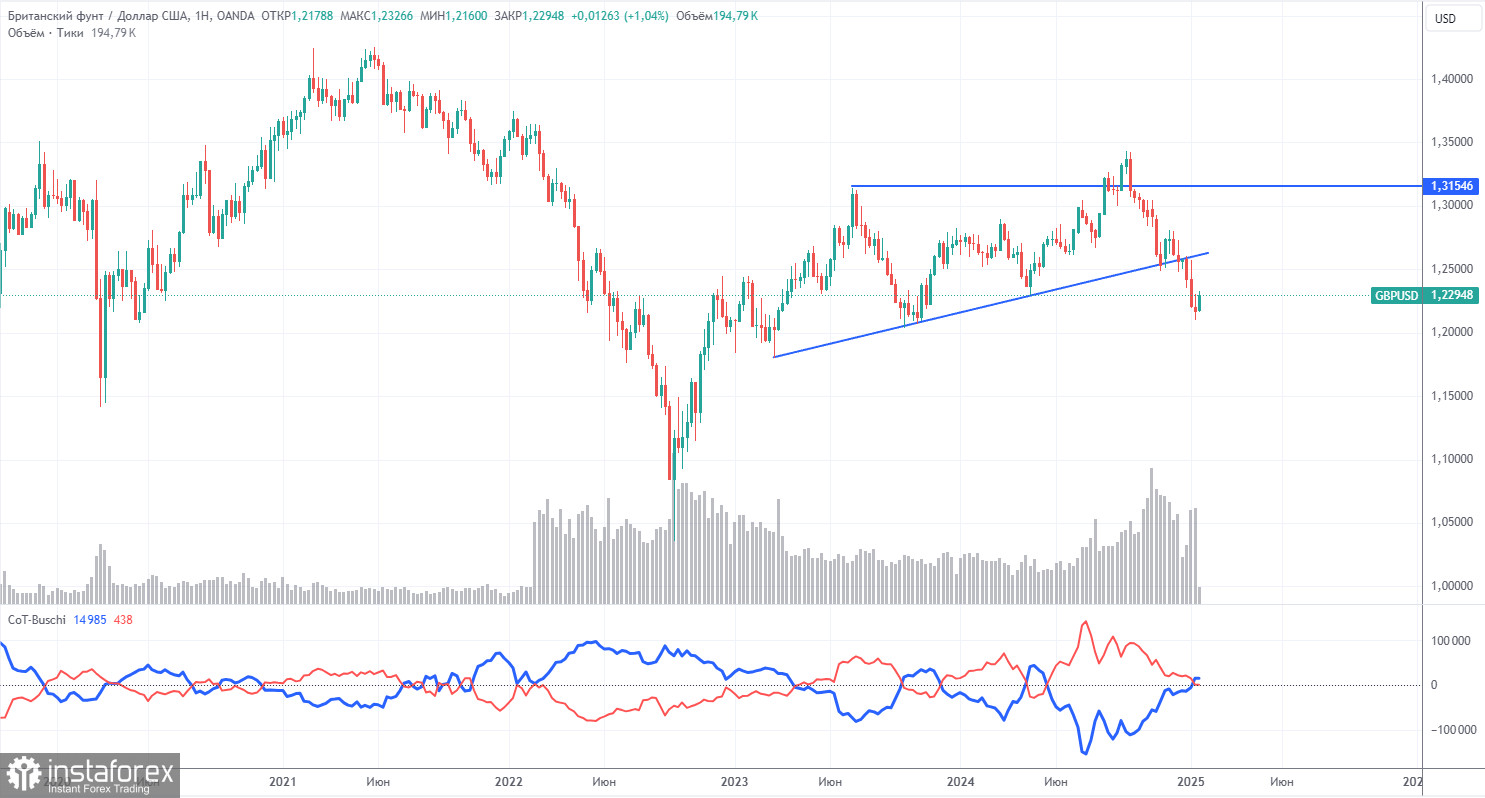
COT reports on the British pound show that the sentiment among commercial traders has been constantly changing in recent years. The red and blue lines in the reports, representing the net positions of commercial and non-commercial traders, frequently intersect and are typically close to the zero mark. Currently, these lines are near each other, suggesting there are approximately equal numbers of long and short positions.

On the weekly timeframe, the price initially broke through the 1.3154 level and then dropped to the trend line, which it successfully breached. Breaking this trend line suggests a high probability of the pound's continued decline. This concerns the long-term perspective.

According to the latest COT report, the "Non-commercial" group closed 700 buy contracts and opened 13,300 sell contracts. As a result, the net position of non-commercial traders decreased by 12,600 contracts over the week, which is negative for the pound.

The fundamental outlook still does not provide any support for long-term purchases of the pound sterling. The currency has a strong likelihood of resuming its global downward trend. Thus, the net position may continue to decline, indicating a reduced demand for the pound sterling.

GBP/USD 1-Hour Analysis

This image is no longer relevant

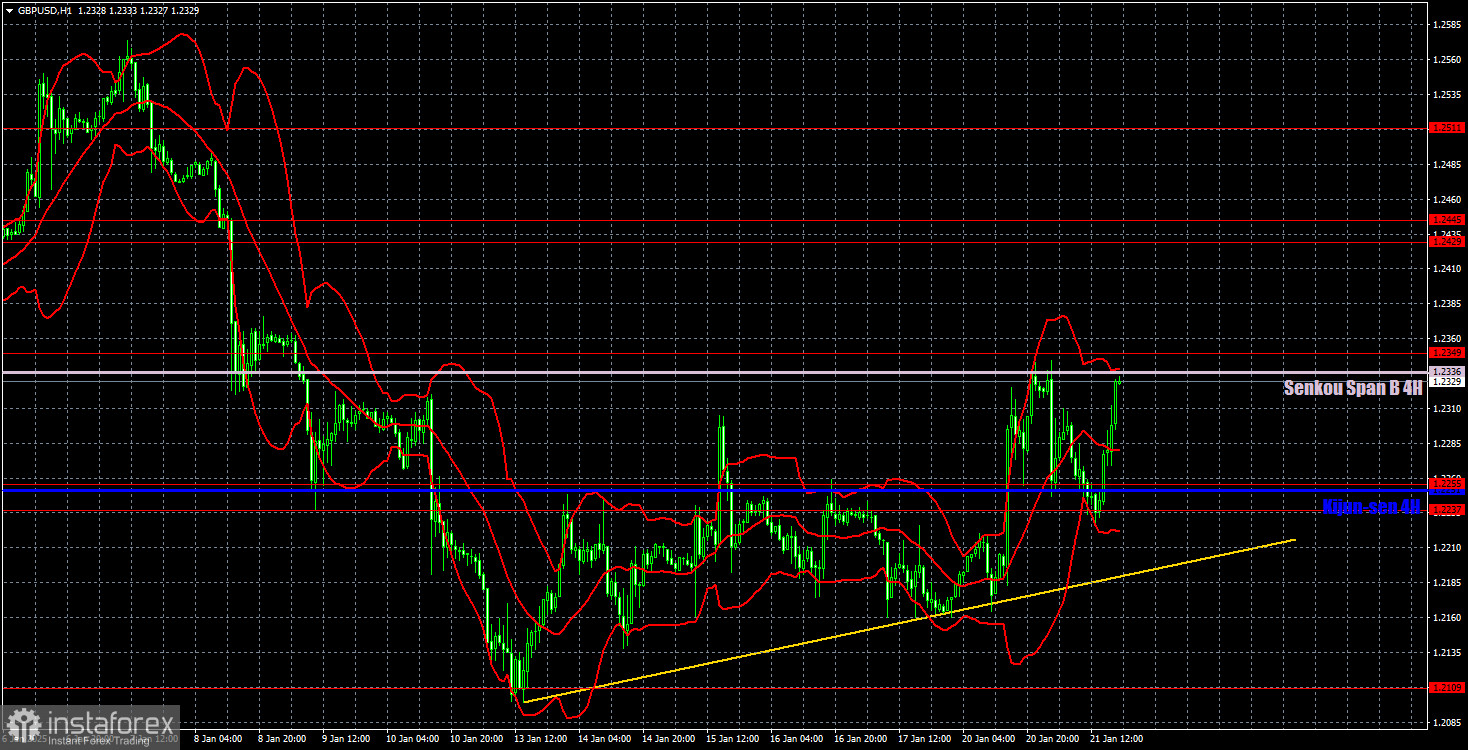
On the hourly timeframe, GBP/USD continues to show a bearish outlook, and any new upward trend is unlikely to result in significant growth for the pound. Currently, there are no fundamental reasons for the pound to rise, except for the occasional technical corrections that occur. This pattern of weak corrections followed by sharp declines has been consistently observed week after week. In the medium term, we expect movement towards $1.1800.

For January 22, the following key levels are identified: 1.2052, 1.2109, 1.2237–1.2255, 1.2349, 1.2429–1.2445, 1.2511, 1.2605–1.2620, 1.2691–1.2701, and 1.2796–1.2816. Additionally, the Senkou Span B line at 1.2336 and the Kijun-sen line at 1.2252 may also serve as significant signals. It is advisable to place a Stop Loss at breakeven once the price moves 20 pips in the correct direction. Keep in mind that the Ichimoku indicator lines can shift throughout the day, so this should be taken into account when determining trading signals.

There are no major events scheduled in either the UK or the US on Wednesday. Therefore, we anticipate market stabilization and an easing of the panic-driven selloff of the dollar due to Donald Trump's actions.

Illustration Explanations:

  • Support and Resistance Levels (thick red lines): Thick red lines indicate where movement may come to an end. Please note that these lines are not sources of trading signals.
  • Kijun-sen and Senkou Span B Lines: Ichimoku indicator lines transferred from the 4-hour timeframe to the hourly timeframe. These are strong lines.
  • Extreme Levels (thin red lines): Thin red lines where the price has previously bounced. These serve as sources of trading signals.
  • Yellow Lines: Trendlines, trend channels, or any other technical patterns.
  • Indicator 1 on COT Charts: Represents the net position size for each category of traders.
Paolo Greco,
Analytical expert of InstaTrade
© 2007-2025

Recommended Stories

How to Trade the GBP/USD Pair on July 14? Simple Tips and Trade Analysis for Beginners

Analysis of Friday's Trades 1H Chart of GBP/USD The GBP/USD pair traded with a relatively substantial decline on Friday. Why did the British pound fall again while the euro remained

Paolo Greco 06:30 2025-07-14 UTC+2

How to Trade the EUR/USD Pair on July 14? Simple Tips and Trade Analysis for Beginners

Analysis of Friday's Trades 1H Chart of EUR/USD On Friday, the EUR/USD currency pair continued its mild downward movement, in line with the current trend. We've been saying the same

Paolo Greco 06:30 2025-07-14 UTC+2

Trading Recommendations and Trade Breakdown for GBP/USD on July 14. The British Pound Maintains a Bearish Bias

The GBP/USD currency pair continued its downward movement throughout Friday. We cannot say there were strong reasons for this, but in the morning, the UK released reports on GDP (monthly

Paolo Greco 04:33 2025-07-14 UTC+2

Trading Recommendations and Trade Breakdown for EUR/USD on July 14. The Dollar Is Tired

The EUR/USD currency pair showed virtually no decline throughout Friday. As we warned in the previous article, the 1.1666 level is a strong one, and it would be difficult

Paolo Greco 04:33 2025-07-14 UTC+2

How to Trade GBP/USD on July 11h? Simple Tips and Trade Analysis for Beginners

Thursday Trade Review: GBP/USD, 1H Chart On Thursday, the GBP/USD pair continued its downward movement, mirroring the EUR/USD pair. The behavior of these two major currency pairs was nearly identical

Paolo Greco 08:43 2025-07-11 UTC+2

How to Trade EUR/USD on July 11th? Simple Tips and Trade Review for Beginners

On Thursday, the EUR/USD currency pair continued its weak downward movement in line with the current trend. We've been saying the same thing all week because very little is changing

Paolo Greco 08:36 2025-07-11 UTC+2

GBP/USD Trading Recommendations and Trade Review for July 11th

On Thursday, the GBP/USD currency pair continued its moderate decline. Over the past two weeks, the British pound has depreciated by 220 points, with approximately 150 of those losses occurring

Paolo Greco 08:30 2025-07-11 UTC+2

EUR/USD Trading Recommendations and Trade Review for July 11th

EUR/USD 5M Analysis On Thursday, the EUR/USD currency pair continued its sluggish decline, completely ignoring the fundamental backdrop. As a reminder, this week Donald Trump announced new tariffs targeting both

Paolo Greco 08:19 2025-07-11 UTC+2

How to Trade the GBP/USD Currency Pair on July 10th: Simple Tips and Trade Analysis for Beginners

Wednesday Trade Analysis: GBP/USD – 1H Chart On Wednesday, the GBP/USD pair was also stuck in a flat movement, with very low volatility. There were virtually no price movements during

Paolo Greco 08:56 2025-07-10 UTC+2

How to Trade the EUR/USD Currency Pair on July 10th: Simple Tips and Trade Analysis for Beginners

Wednesday Trade Analysis: EUR/USD – 1H Chart On Wednesday, the EUR/USD pair continued to trade in line with the prevailing trend from the previous week. Market activity was minimal throughout

Paolo Greco 08:48 2025-07-10 UTC+2
Can't speak right now?
Ask your question in the chat.
 

Dear visitor,

Your IP address shows that you are currently located in the USA. If you are a resident of the United States, you are prohibited from using the services of InstaFintech Group including online trading, online transfers, deposit/withdrawal of funds, etc.

If you think you are seeing this message by mistake and your location is not the US, kindly proceed to the website. Otherwise, you must leave the website in order to comply with government restrictions.

Why does your IP address show your location as the USA?

  • - you are using a VPN provided by a hosting company based in the United States;
  • - your IP does not have proper WHOIS records;
  • - an error occurred in the WHOIS geolocation database.

Please confirm whether you are a US resident or not by clicking the relevant button below. If you choose the wrong option, being a US resident, you will not be able to open an account with InstaTrade anyway.

We are sorry for any inconvenience caused by this message.