empty
23.09.2024 10:20 AM
Learning and Analysis: Trading Plan for Novice Traders EUR/USD and GBP/USD on 23.09.24

Details from the Economic Calendar on September 20

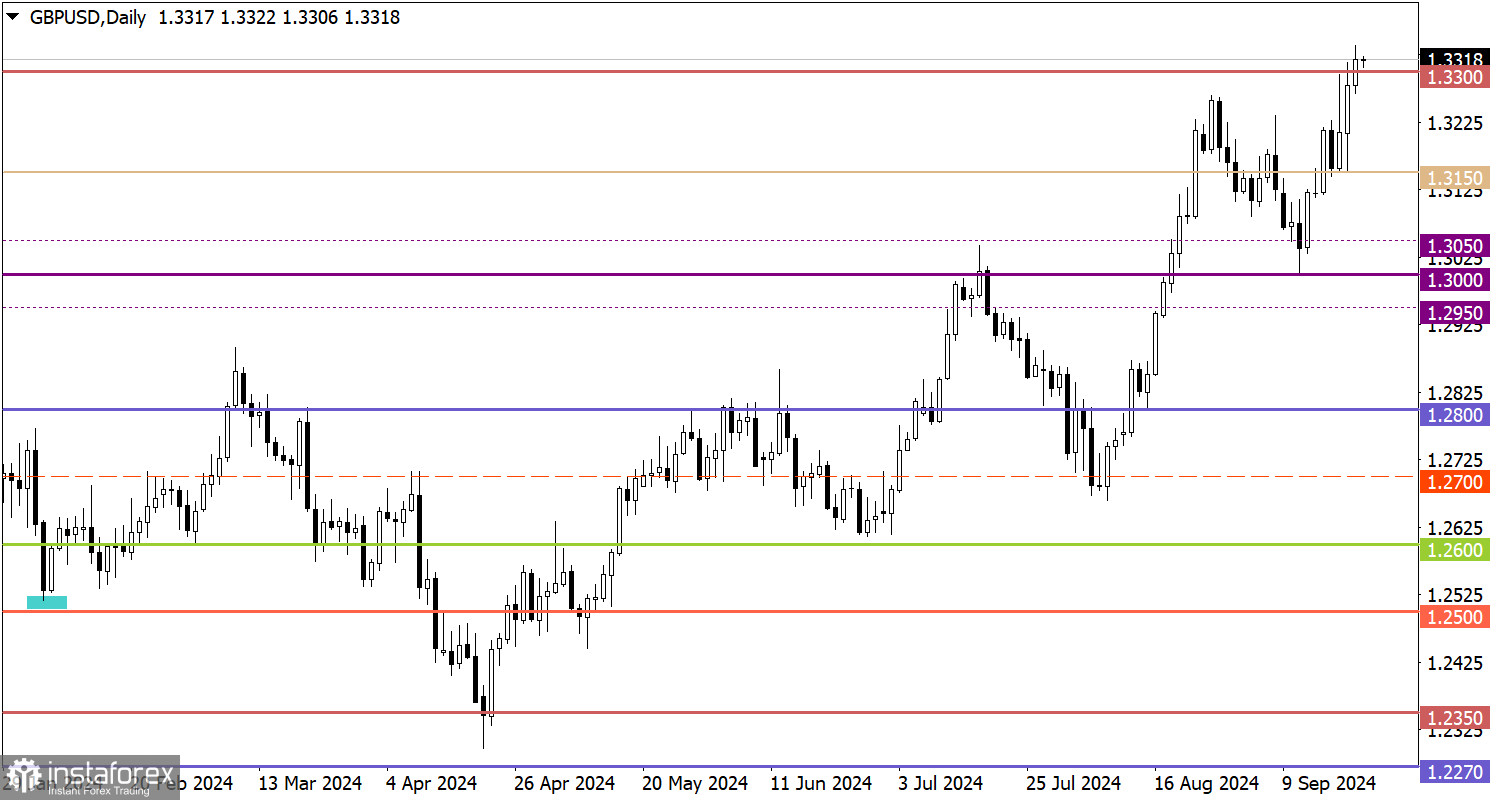
On Friday, the data on retail sales in the UK were published, showing a 1% increase in August. The actual figure significantly exceeded the forecasts of analytical agencies.

Analysis of Trading Charts from September 20

  • EUR/USD Currency Pair

The movement around the local high of the mid-term trend indicates a prevailing bullish sentiment among market participants.

  • GBP/USD Currency Pair

The close of the past trading week above the 1.3300 level indicates a prevailing bullish sentiment among market participants, which has already led to an update of the mid-term high.

This image is no longer relevant

Economic Calendar for September 23

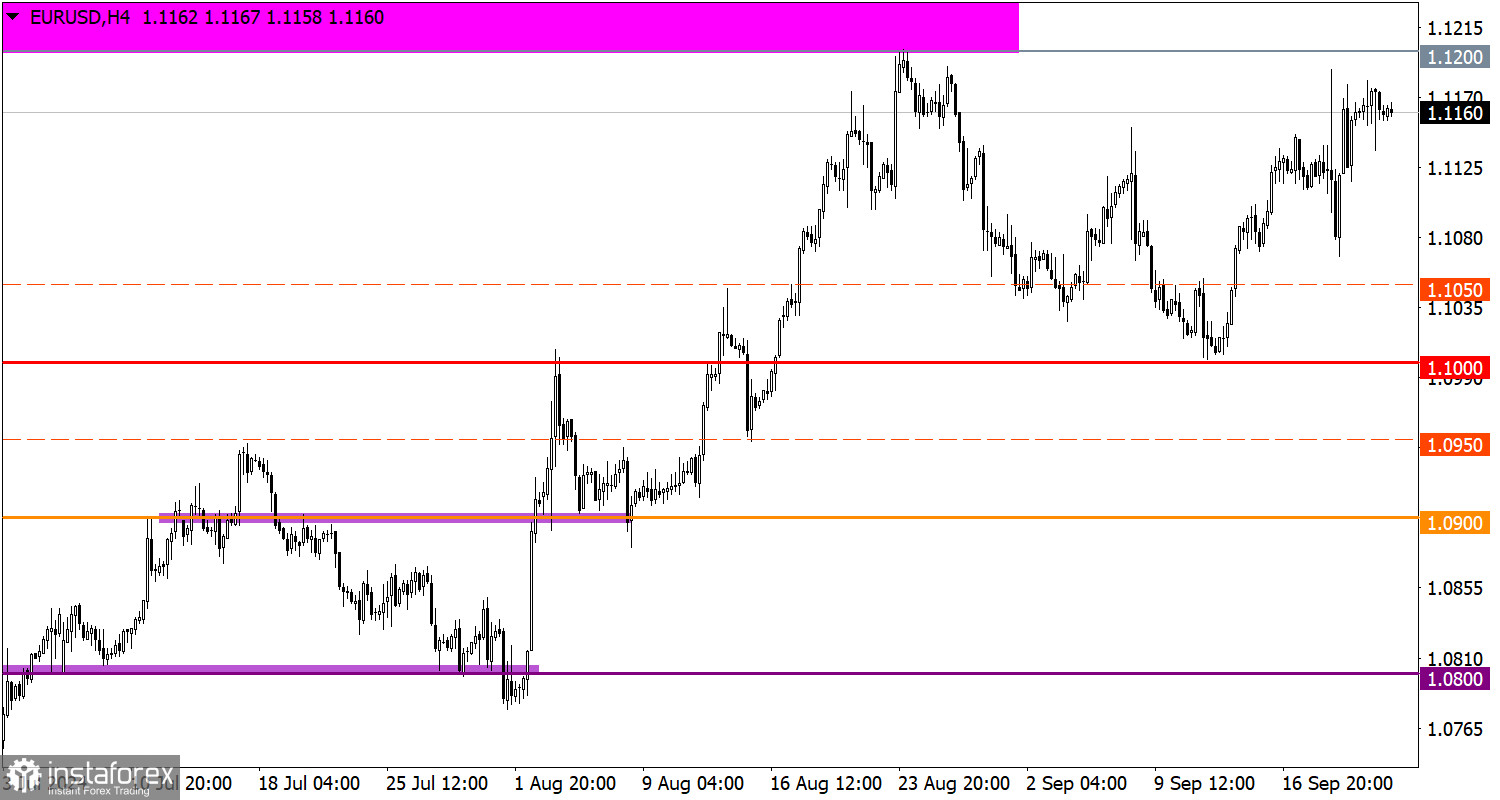
The preliminary estimates of business activity indices are expected to be released today. In the Eurozone and the UK, no significant changes are anticipated for the main indicators, while in the United States, a noticeable decline is projected. Specifically, the composite business activity index in the US is expected to decrease from 54.6 points to 53.0 points.

Trading Plan – EUR/USD

Considering the potential for further selling of dollar positions in financial markets, the euro's upward momentum could lead the price to reach at least the resistance level of 1.1200/1.1280. For more significant price changes, it will be necessary to stabilize above these levels, which would indicate an update of the mid-term high. Until then, the resistance area will continue to exert pressure on buyers.

This image is no longer relevant

Trading Plan – GBP/USD

The price has stabilized above the 1.3300 level, which indicates the potential for further growth of the British pound. A gradual movement toward the 1.3600 level is possible if the upward cycle remains uninterrupted. However, if the price drops below 1.3300, a temporary stagnation or pullback may occur.

This image is no longer relevant

What Is Reflected on the Trading Charts?

  • Candlestick Chart: This consists of rectangular white and black bars with lines at the top and bottom. By analyzing each candle in detail, you can observe its characteristics relative to a specific time period: opening price, closing price, highest price, and lowest price.
  • Horizontal Levels: These represent price coordinates where the market might experience a pause or reversal. In trading, these levels are commonly referred to as support and resistance.
  • Circles and Rectangles: These highlight examples where the price reversed in the past. The color highlights indicate horizontal lines that may exert pressure on the price in the future.
  • Up/Down Arrows: These serve as indicators of potential future price direction.
Gven Podolsky,
Analytical expert of InstaTrade
© 2007-2025

Recommended Stories

How to Trade the GBP/USD Pair on August 13? Simple Tips and Trade Analysis for Beginners

Analysis of Tuesday's Trades 1H Chart of GBP/USD The GBP/USD pair also showed a relatively strong upward move, but unlike EUR/USD, it began rising from early morning. Data from

Paolo Greco 06:44 2025-08-13 UTC+2

How to Trade the EUR/USD Pair on August 13? Simple Tips and Trade Analysis for Beginners

Analysis of Tuesday's Trades 1H Chart of EUR/USD On Tuesday, the EUR/USD currency pair traded higher for a completely logical reason. The US Consumer Price Index showed a very unexpected

Paolo Greco 06:44 2025-08-13 UTC+2

Trading Recommendations and Trade Breakdown for GBP/USD on August 13 – The Pound Surprised Traders

The GBP/USD currency pair also traded higher on Tuesday, but this movement was driven not only by the U.S. inflation report but also by UK data. We cannot say that

Paolo Greco 03:49 2025-08-13 UTC+2

Trading Recommendations and Trade Breakdown for EUR/USD on August 13 – The Inflation Report Ruined Everything

The EUR/USD currency pair resumed its upward movement on Tuesday. This resumption was not without reason—it was entirely logical. While the market confidently ignored the morning European reports, it could

Paolo Greco 03:49 2025-08-13 UTC+2

How to Trade the GBP/USD Pair on August 12? Simple Tips and Trade Analysis for Beginners

Analysis of Monday's Trades 1H Chart of GBP/USD The GBP/USD pair also declined slightly on Monday, but the strengthening of the dollar means nothing. The price did not even manage

Paolo Greco 06:57 2025-08-12 UTC+2

How to Trade the EUR/USD Pair on August 12? Simple Tips and Trade Analysis for Beginners

Analysis of Monday's Trades 1H Chart of EUR/USD On Monday, the EUR/USD currency pair traded lower, despite the absence of any macroeconomic or fundamental reasons for such movement. However

Paolo Greco 06:57 2025-08-12 UTC+2

Trading Recommendations and Trade Breakdown for GBP/USD on August 12 – The Trend Remains

On Monday, the GBP/USD currency pair slightly declined toward the new ascending trendline, which in no way disrupted the current trend. Indeed, few expected the US currency to strengthen

Paolo Greco 03:32 2025-08-12 UTC+2

Trading Recommendations and Trade Breakdown for EUR/USD on August 12 – A Quiet Monday and Inflation

On Monday, the EUR/USD currency pair showed a downward movement but generally traded within roughly the same range as in recent days. The euro had been rising for a week

Paolo Greco 03:32 2025-08-12 UTC+2

How to Trade the GBP/USD Pair on August 11? Simple Tips and Trade Analysis for Beginners

Analysis of Friday's Trades 1H Chart of GBP/USD The GBP/USD pair continued its upward movement on Friday. The move was extremely weak, with the day's total volatility amounting to only

Paolo Greco 06:00 2025-08-11 UTC+2

How to Trade the EUR/USD Pair on August 11? Simple Tips and Trade Analysis for Beginners

Analysis of Friday's Trades 1H Chart of EUR/USD On Friday, the EUR/USD currency pair traded completely flat. No macroeconomic reports were scheduled for that day, so traders had nothing

Paolo Greco 06:00 2025-08-11 UTC+2
Can't speak right now?
Ask your question in the chat.
 

Dear visitor,

Your IP address shows that you are currently located in the USA. If you are a resident of the United States, you are prohibited from using the services of InstaFintech Group including online trading, online transfers, deposit/withdrawal of funds, etc.

If you think you are seeing this message by mistake and your location is not the US, kindly proceed to the website. Otherwise, you must leave the website in order to comply with government restrictions.

Why does your IP address show your location as the USA?

  • - you are using a VPN provided by a hosting company based in the United States;
  • - your IP does not have proper WHOIS records;
  • - an error occurred in the WHOIS geolocation database.

Please confirm whether you are a US resident or not by clicking the relevant button below. If you choose the wrong option, being a US resident, you will not be able to open an account with InstaTrade anyway.

We are sorry for any inconvenience caused by this message.