See also
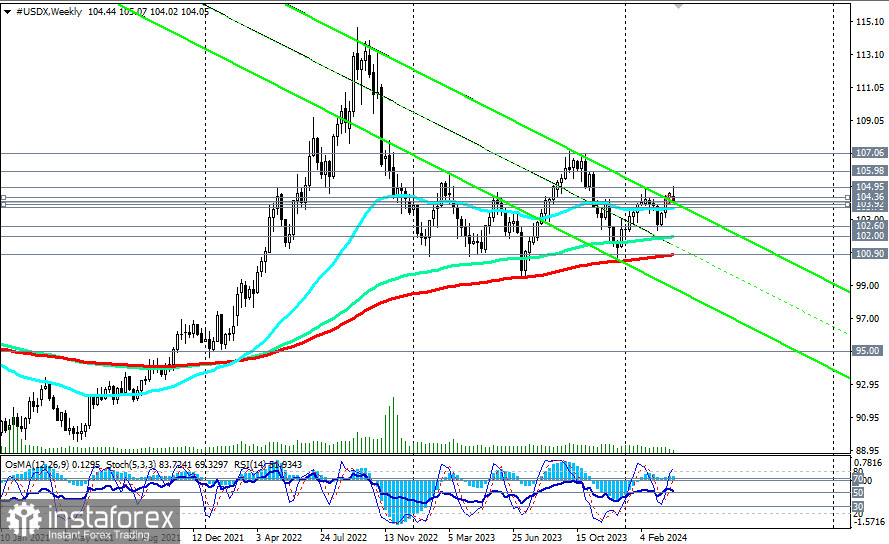
On Thursday, the market observes somewhat contradictory dynamics of the dollar. It weakens in the DXY index, which primarily consists of the euro, but strengthens against safe-haven assets—the yen, franc, and gold.
At the same time, market participants who are in active short positions on the dollar may want to pay attention to the dynamics of U.S. government bond yields, which continue to rise.
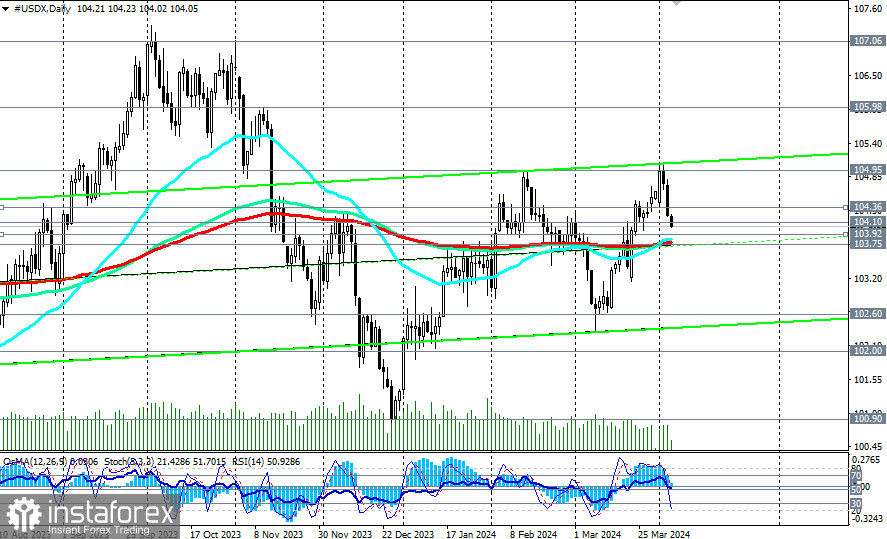
From a technical point of view, the dollar index (CFD #USDX in the MT4 terminal) remains in a bullish market zone, medium-term—above the support level of 103.75 (200 EMA on the daily chart), long-term—above the key support level of 100.90 (200 EMA on the weekly chart).
Therefore, long positions on the dollar index remain preferable for now.
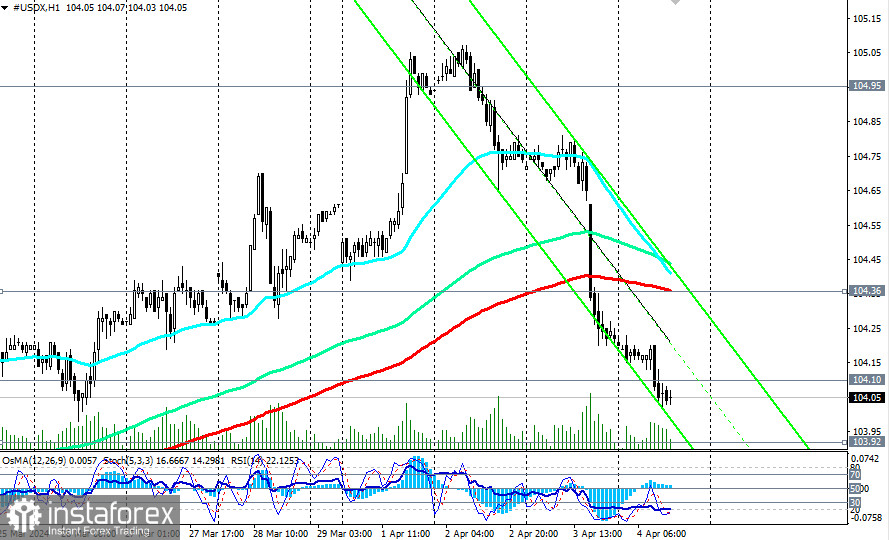
A signal for new purchases could be the breakout of the important short-term resistance level of 104.36 (200 EMA on the 1-hour chart).
In case of a decrease to the support levels of 103.92 (200 EMA on the 4-hour chart) and 103.75 (200 EMA, 144 EMA on the daily chart), it is possible to place pending limit orders for purchase with stops below the 103.60 mark.
In an alternative scenario, after the confirmed breakout of the support level at 103.75, the price may deepen into the downward channel on the weekly chart, with targets at support levels of 102.60 and 102.00 (144 EMA on the weekly chart).
The breakout of the key support level of 100.90 (200 EMA on the weekly chart) will bring the DXY into the long-term bear market zone. The bullish trend of the dollar will be broken.
This scenario may gain momentum if tomorrow's U.S. Labor Department report turns out to be significantly weaker than forecasted. Further dynamics of the dollar and its DXY index will largely depend on the fundamental background and the actions of the Federal Reserve.
Support levels: 104.10, 104.00, 103.92, 103.75, 103.00, 102.60, 102.00, 101.00, 100.90, 100.00
Resistance levels: 104.36, 104.95, 105.00, 106.00, 106.80, 107.00, 107.30
Trading Scenarios
Main scenario: BuyStop 104.40. Stop-Loss 103.60. Targets 104.95, 105.00, 106.00, 106.80, 107.00, 107.30
Alternative scenario: SellStop 103.60. Stop-Loss 104.10. Targets 103.00, 102.60, 102.00, 101.00, 100.90, 100.00
"Targets" correspond to support/resistance levels. This also does not mean that they will necessarily be reached, but they can serve as a guideline for planning and placing your trading positions.
You have already liked this post today
*The market analysis posted here is meant to increase your awareness, but not to give instructions to make a trade.
Analysis of Thursday's Trades 1H Chart of GBP/USD The GBP/USD pair also corrected slightly lower on Thursday amid the high PPI reading. As we have already mentioned, even such
Analysis of Thursday's Trades 1H Chart of EUR/USD On Thursday, the EUR/USD currency pair traded lower. Four macroeconomic reports were published during the day, three of which had no impact
On Thursday, the GBP/USD currency pair also traded lower, with the U.S. Producer Price Index being the main driver. Initially, we assumed that this indicator was unlikely to provoke
On Thursday, the EUR/USD currency pair showed a decent decline, which fully aligns with the current technical picture. It should be noted that an uptrend does not mean the price
Analysis of Wednesday's Trades 1H Chart of GBP/USD The GBP/USD pair also continued moving north on Wednesday, although there were no local reasons for this. Nevertheless, the British pound keeps
Analysis of Wednesday's Trades 1H Chart of EUR/USD On Wednesday, the EUR/USD currency pair continued its upward movement. It was not a strong rise, but it was upward, in line
On Wednesday, the GBP/USD currency pair continued its upward movement, despite the absence of significant reports, news from Donald Trump, and fundamental events during the day. Once again, we draw
On Wednesday, the EUR/USD currency pair continued its upward movement, despite the absence of any important events or reports during the day. However, the broader fundamental backdrop — driven
Analysis of Tuesday's Trades 1H Chart of GBP/USD The GBP/USD pair also showed a relatively strong upward move, but unlike EUR/USD, it began rising from early morning. Data from
Analysis of Tuesday's Trades 1H Chart of EUR/USD On Tuesday, the EUR/USD currency pair traded higher for a completely logical reason. The US Consumer Price Index showed a very unexpected
InstaTrade in figures
Your IP address shows that you are currently located in the USA. If you are a resident of the United States, you are prohibited from using the services of InstaFintech Group including online trading, online transfers, deposit/withdrawal of funds, etc.
If you think you are seeing this message by mistake and your location is not the US, kindly proceed to the website. Otherwise, you must leave the website in order to comply with government restrictions.
Why does your IP address show your location as the USA?
Please confirm whether you are a US resident or not by clicking the relevant button below. If you choose the wrong option, being a US resident, you will not be able to open an account with InstaTrade anyway.
We are sorry for any inconvenience caused by this message.