empty
06.03.2024 11:28 AM
EUR/USD and GBP/USD: trading plan for beginners on March 6

Detail of economic calendar on March 5

On Tuesday, traders got to know HCOB PMIs for the Eurozone. The actual data was stronger than flash estimates. The PMIs by the S&P Global and ISM for the US were also much better than estimated. The composite PMI by the S&P 500 Global went up, defying expectations for its decline.

Overview of charts on March 5

The EUR/USD pair is one step away from exiting the sideways channel of 1.0800/1.0850. However, analyzing the trading day on March 5, the instrument is currently accumulating trading forces, which is mirrored in the form of a Doji-type candle.

The GBP/USD pair overcame the level of 1.2700 during its rapid rally. This indicates a high excitement among traders about the upward cycle. As a result, traders increased long positions in the pound sterling.

This image is no longer relevant

Economic calendar on March 6

Data on retail sales in the eurozone will be available today. Retail sales could have slowed the rate of decline from -0.8% to -0.3% in February. In addition, forecasts for the labor market in the US are rather negative, since employment may grow by only 90K, which is considered a low figure. Let me remind you that the deteriorating situation in the labor market is a convincing factor for the Federal Reserve as the regulator may decide on an early rate cut.

This image is no longer relevant

Trading plan for EUR/USD on March 6

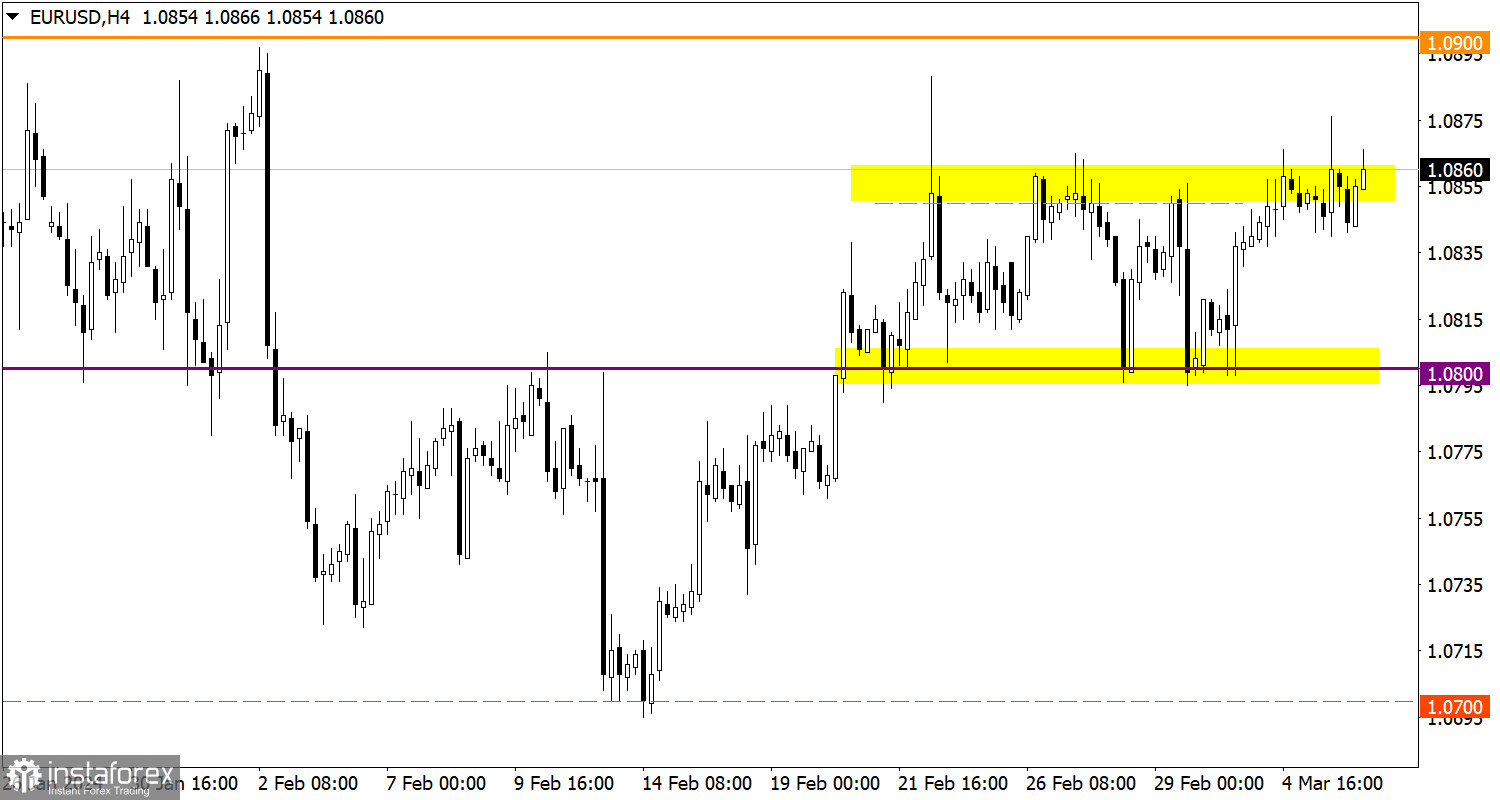
In case EUR/USD rises above 1.0850, the price may exit its trading range. Consequently, the euro will assert its strength, accompanied by increasing long positions toward 1.0900. As for the downward scenario, it will become relevant if the price does not stabilize above the upper border of the sideways channel. At the same time, EUR/USD could trade in the range of 50–60 pips.

This image is no longer relevant

Trading plan for GBP/USD on March 6

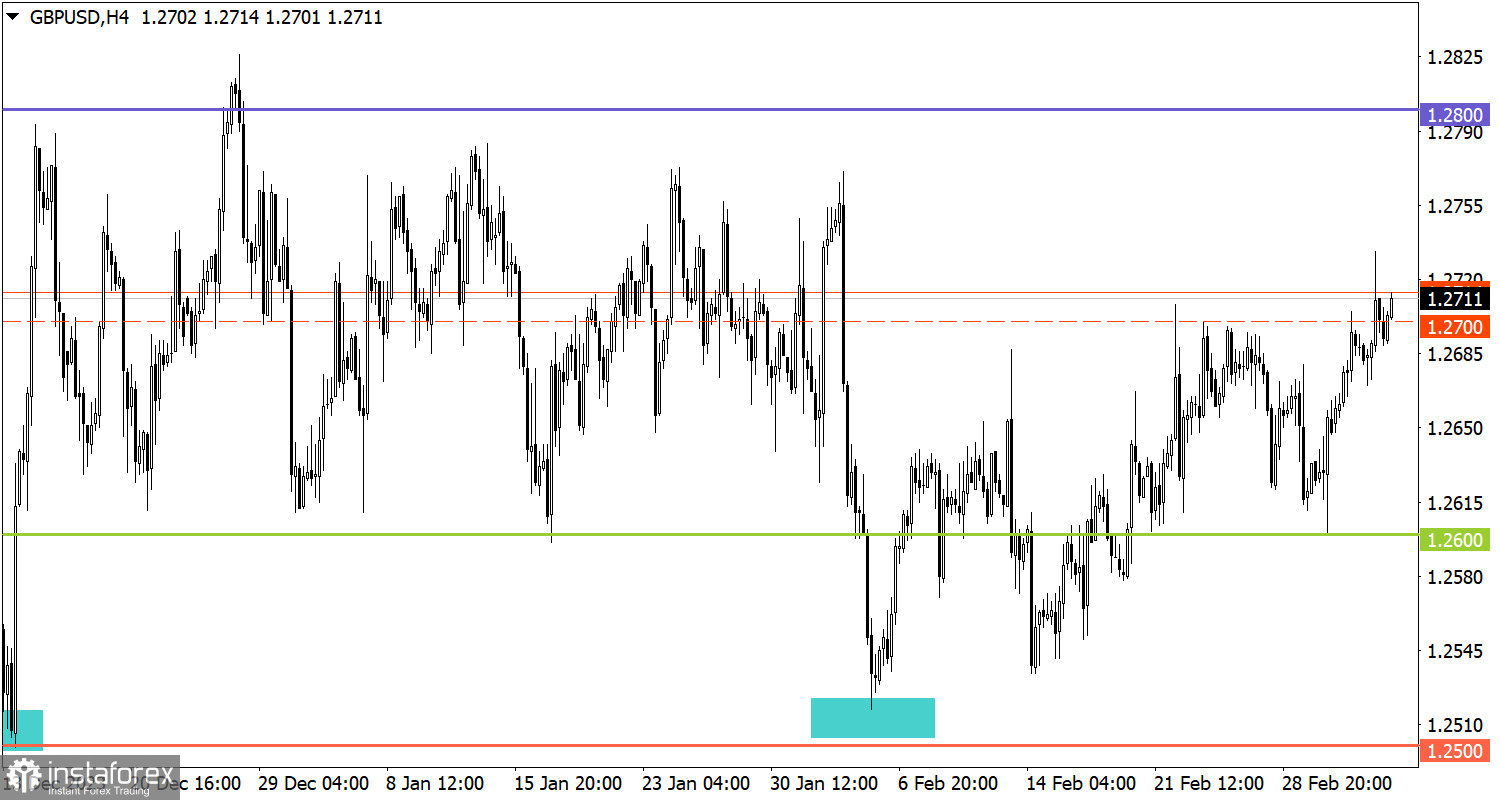
In case of the price growth, GBP/USD is likely to swing around 1.2800. This level previously served as resistance. However, if the price again falls below 1.2700 at the end of the day, then the sideways scenario of 1.2600/1.2700 will remain relevant in the market.

What's on charts

The candlestick chart type consists of graphic rectangles in white and black with lines at the top and bottom. With a detailed analysis of each individual candle, you can see its characteristics relative to a particular time period: opening price, closing price, maximum and minimum price.

Horizontal levels are price coordinates relative to which a price may stop or revered its trajectory. In the market, these levels are called support and resistance.

Circles and rectangles are highlighted examples where the price developed. This color highlighting indicates horizontal lines that may put pressure on the price in the future.

Up/down arrows are guidelines for a possible future trajectory.

Gven Podolsky,
Analytical expert of InstaTrade
© 2007-2025

Recommended Stories

How to Trade GBP/USD on July 11h? Simple Tips and Trade Analysis for Beginners

Thursday Trade Review: GBP/USD, 1H Chart On Thursday, the GBP/USD pair continued its downward movement, mirroring the EUR/USD pair. The behavior of these two major currency pairs was nearly identical

Paolo Greco 08:43 2025-07-11 UTC+2

How to Trade EUR/USD on July 11th? Simple Tips and Trade Review for Beginners

On Thursday, the EUR/USD currency pair continued its weak downward movement in line with the current trend. We've been saying the same thing all week because very little is changing

Paolo Greco 08:36 2025-07-11 UTC+2

GBP/USD Trading Recommendations and Trade Review for July 11th

On Thursday, the GBP/USD currency pair continued its moderate decline. Over the past two weeks, the British pound has depreciated by 220 points, with approximately 150 of those losses occurring

Paolo Greco 08:30 2025-07-11 UTC+2

EUR/USD Trading Recommendations and Trade Review for July 11th

EUR/USD 5M Analysis On Thursday, the EUR/USD currency pair continued its sluggish decline, completely ignoring the fundamental backdrop. As a reminder, this week Donald Trump announced new tariffs targeting both

Paolo Greco 08:19 2025-07-11 UTC+2

How to Trade the GBP/USD Currency Pair on July 10th: Simple Tips and Trade Analysis for Beginners

Wednesday Trade Analysis: GBP/USD – 1H Chart On Wednesday, the GBP/USD pair was also stuck in a flat movement, with very low volatility. There were virtually no price movements during

Paolo Greco 08:56 2025-07-10 UTC+2

How to Trade the EUR/USD Currency Pair on July 10th: Simple Tips and Trade Analysis for Beginners

Wednesday Trade Analysis: EUR/USD – 1H Chart On Wednesday, the EUR/USD pair continued to trade in line with the prevailing trend from the previous week. Market activity was minimal throughout

Paolo Greco 08:48 2025-07-10 UTC+2

Trading Recommendations and Trade Review for GBP/USD on July 10th

On Wednesday, GBP/USD remained within its descending channel. However, a more interesting setup emerged in the 4-hour time frame, where the price attempted several times to break through the Senkou

Paolo Greco 06:57 2025-07-10 UTC+2

Trading Recommendations and Trade Review for EUR/USD on July 10th

On Wednesday, the EUR/USD pair continued moving within a weak downward channel, as previously forecast. However, volatility dropped to a minimum, there was no macroeconomic backdrop for the third consecutive

Paolo Greco 06:45 2025-07-10 UTC+2

How to Trade the GBP/USD Currency Pair on July 9th: Simple Tips and Trade Analysis for Beginners

On Tuesday, the GBP/USD pair continued its moderate downward movement, which is clearly of a technical and corrective nature. On both Monday and Tuesday, there were no significant macroeconomic events

Paolo Greco 08:46 2025-07-09 UTC+2

How to Trade the EUR/USD Currency Pair on July 9th? Simple Tips and Trade Breakdown for Beginners

On Tuesday, the EUR/USD currency pair continued its mild downward movement in line with the prevailing trend. After a fairly strong upward move, the market began a correction. The nature

Paolo Greco 08:28 2025-07-09 UTC+2
Can't speak right now?
Ask your question in the chat.
 

Dear visitor,

Your IP address shows that you are currently located in the USA. If you are a resident of the United States, you are prohibited from using the services of InstaFintech Group including online trading, online transfers, deposit/withdrawal of funds, etc.

If you think you are seeing this message by mistake and your location is not the US, kindly proceed to the website. Otherwise, you must leave the website in order to comply with government restrictions.

Why does your IP address show your location as the USA?

  • - you are using a VPN provided by a hosting company based in the United States;
  • - your IP does not have proper WHOIS records;
  • - an error occurred in the WHOIS geolocation database.

Please confirm whether you are a US resident or not by clicking the relevant button below. If you choose the wrong option, being a US resident, you will not be able to open an account with InstaTrade anyway.

We are sorry for any inconvenience caused by this message.