empty
04.03.2024 09:39 AM
Indicator Analysis of EUR/USD on March 4, 2024

Trend analysis (Fig. 1).

The EUR/USD currency pair may move upward from the level of 1.0838 (closing of Friday's daily candlestick) to 1.0864, the 38.2% pullback level (red dotted line). In the case of testing this level, a downward movement is possible to 1.0842, the 76.4% pullback level (blue dotted line).

This image is no longer relevant

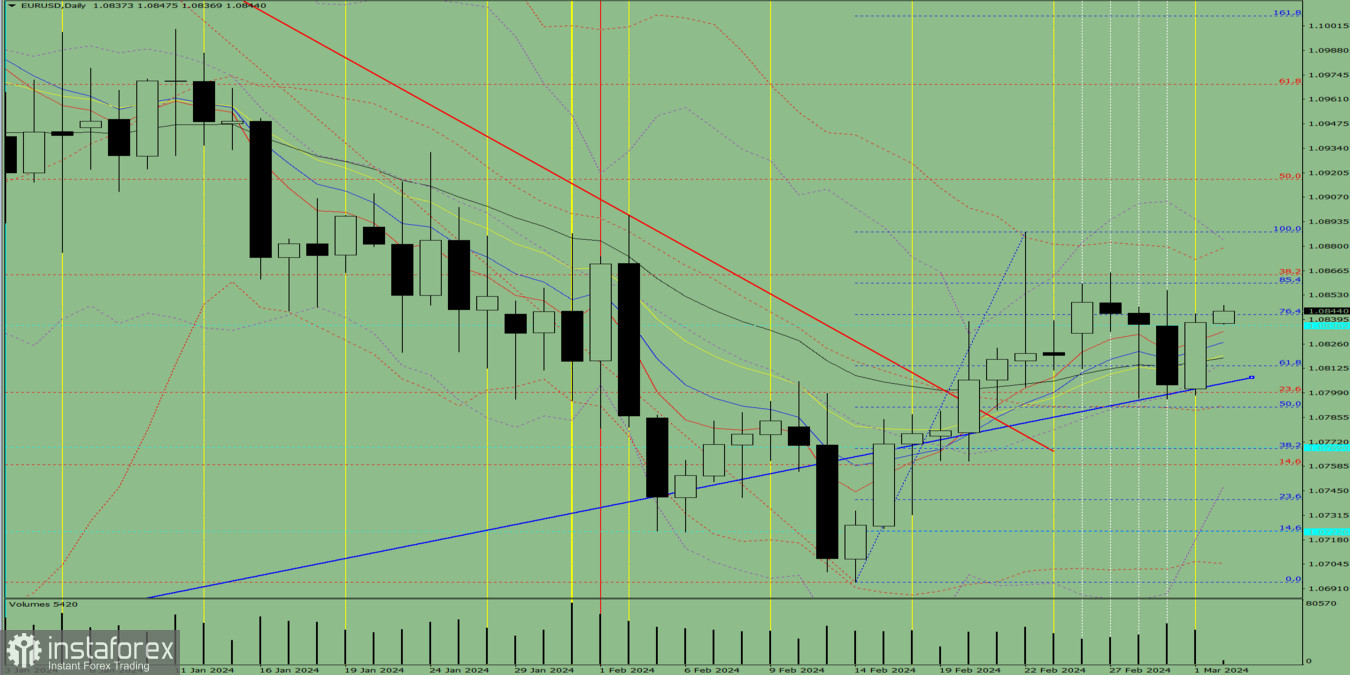
Fig. 1 (daily chart).

Comprehensive analysis:

  • Indicator analysis – up;
  • Fibonacci levels – up;
  • Volumes – up;
  • Candlestick analysis – up;
  • Trend analysis – up;
  • Bollinger bands – up;
  • Weekly chart – up.

Today, the price may move upward from the level of 1.0838 (closing of Friday's daily candlestick) to 1.0864, the 38.2% pullback level (red dotted line). In the case of testing this level, a downward movement is possible to 1.0842, the 76.4% pullback level (blue dotted line).

Alternatively, from the level of 1.0838 (closing of Friday's daily candlestick), the price may move upward to 1.0864, the 38.2% pullback level (red dotted line). In the case of testing this level, a continued upward movement is possible to the upper fractal at 1.0888 (blue dotted line).

Stefan Doll,
Analytical expert of InstaTrade
© 2007-2025

Recommended Stories

Forex forecast 18/07/2025: EUR/USD, GBP/USD, USD/JPY, Oil, Ethereum and Bitcoin

Useful links: My other articles are available in this section InstaForex course for beginners Popular Analytics Open trading account Important: The begginers in forex trading need to be very careful

Sebastian Seliga 14:51 2025-07-18 UTC+2

GBP/USD. Daily Overview on July 18, 2025

On Thursday, the pair moved downward and nearly tested the lower fractal at 1.3369 (yellow dashed line), then reversed upward and closed the daily candlestick at 1.3412. Today, the pair

Stefan Doll 13:14 2025-07-18 UTC+2

XAU/USD. Analysis and Forecast

Today, gold is rising. The recent price movement within a range observed since the beginning of this month represents the formation of a "rectangle" pattern, indicating trader indecision. In addition

Irina Yanina 13:06 2025-07-18 UTC+2

EUR/USD. Daily Overview on July 18, 2025

On Thursday, the pair moved downward toward the 61.8% retracement level at 1.1650 (red dashed line), then reversed upward, closing the daily candlestick at 1.1560. Today, the price may continue

Stefan Doll 12:49 2025-07-18 UTC+2

Forecast for EUR/USD on July 18, 2025

On Thursday, the EUR/USD pair returned to the 100.0% corrective level at 1.1574 and bounced off it for the second time in a row. This resulted in a reversal

Samir Klishi 12:16 2025-07-18 UTC+2

Forecast for GBP/USD on July 18, 2025

On the hourly chart, the GBP/USD pair on Thursday returned to the support zone of 1.3357–1.3371 and bounced off it again. This resulted in a reversal in favor

Samir Klishi 11:49 2025-07-18 UTC+2

Trading Signals for EUR/USD for July 18-21, 2025: buy above 1.1596 (200 EMA - 7/8 Murray)

Given that the eagle indicator is showing potential for a possible recovery for the euro, we will look for buying opportunities whenever the euro pulls back and trades above 1.1596

Dimitrios Zappas 08:22 2025-07-18 UTC+2

Trading Signals for BITCOIN for July 18-21, 2025: buy above $118,000 (6/8 Murray - 21 SMA)

If Bitcoin makes a technical correction toward the support at 118,750 or the secondary uptrend channel around 118,200 in the coming hours, this will be seen as a buying opportunity

Dimitrios Zappas 08:22 2025-07-18 UTC+2

Trading Signals for GOLD (XAU/USD) for July 18-21, 2025: buy above $3,330 (21 SMA - 5/8 Murray)

Conversely, if gold falls below 3,320 and breaks the uptrend channel, we could expect a trend reversal, and it may reach the 4/8 Murray line at 3,281, eventually reaching

Dimitrios Zappas 07:23 2025-07-18 UTC+2

If XAU/USD successfully breaks through and closes below the Pivot, it has the potential to continue its decline to the next support level, Friday, July 18, 2025.

XAU/USD – Friday, July 18, 2025. The potential for XAU/USD to weaken continues, as reflected in The EMA (50) is below the EMA (200) and the RSI (14)

Arief Makmur 07:02 2025-07-18 UTC+2
Can't speak right now?
Ask your question in the chat.
 

Dear visitor,

Your IP address shows that you are currently located in the USA. If you are a resident of the United States, you are prohibited from using the services of InstaFintech Group including online trading, online transfers, deposit/withdrawal of funds, etc.

If you think you are seeing this message by mistake and your location is not the US, kindly proceed to the website. Otherwise, you must leave the website in order to comply with government restrictions.

Why does your IP address show your location as the USA?

  • - you are using a VPN provided by a hosting company based in the United States;
  • - your IP does not have proper WHOIS records;
  • - an error occurred in the WHOIS geolocation database.

Please confirm whether you are a US resident or not by clicking the relevant button below. If you choose the wrong option, being a US resident, you will not be able to open an account with InstaTrade anyway.

We are sorry for any inconvenience caused by this message.