empty
18.06.2024 05:17 PM
Trading Signals for GOLD (XAU/USD) for June 18-20, 2024: sell below $2,330 (21 SMA - symmetrical triangle)

This image is no longer relevant

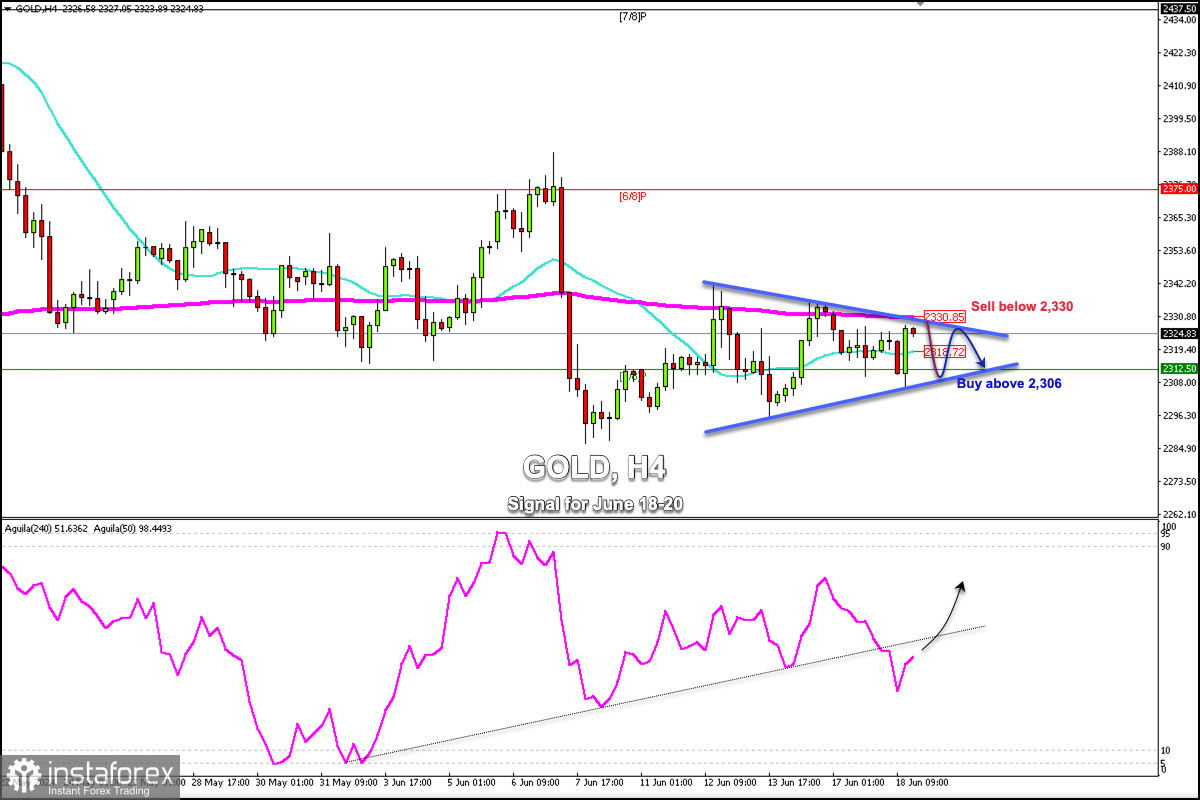
Early in the American session, Gold is trading around 2,324.83 bouncing after having reached a low of around 2,306. The price is now reaching a resistance zone that coincides with the 200 EMA around 2330.

On the H4 chart, we can see that gold is trading within a symmetrical triangle pattern. The metal will likely trade within this pattern in the coming hours and we could expect bearish pressure below 2,330.

In case the XAU/USD trades within the symmetrical triangle pattern and if a technical correction occurs, we could expect a technical bounce of around 2,308 or 2,312. So, we could look for opportunities to buy and sell.

A sharp break of this symmetrical triangle pattern could favor a positive outlook as we see that the eagle indicator is showing a positive signal. Bullish momentum will be confirmed provided that gold consolidates above 2,330 (200 EMA).

On the contrary, a drop and a close below 2,310 on the H4 chart could mean a bearish acceleration. Therefore, gold could fall to the psychological level of 2,300 and even reach the June 7 low of around 2,287.

We must take into account the key levels of 2,330 and 2,312. These levels could offer us some points to sell and buy since gold has been consolidating for almost more than a week. Thus, the odds are there will probably be a sharp break in the coming days.

Dimitrios Zappas,
Analytical expert of InstaTrade
© 2007-2025

Recommended Stories

Forex forecast 15/07/2025: EUR/USD, GBP/USD, USD/JPY, Oil and Bitcoin

Useful links: My other articles are available in this section InstaForex course for beginners Popular Analytics Open trading account Important: The begginers in forex trading need to be very careful

Sebastian Seliga 12:58 2025-07-15 UTC+2

GBP/USD. Analysis and Forecast

Today, the GBP/USD pair is consolidating within the 1.3430–1.3435 level, holding slightly above the three-week low recorded during the Asian session, as markets await the release of U.S. consumer inflation

Irina Yanina 12:18 2025-07-15 UTC+2

Forecast for EUR/USD on July 15, 2025

On Monday, the EUR/USD pair traded sideways, and overall market activity was very low. Thus, despite the prevailing bearish sentiment, bears failed to push the pair lower. A rebound from

Samir Klishi 11:46 2025-07-15 UTC+2

Forecast for GBP/USD on July 15, 2025

On the hourly chart, the GBP/USD pair continued to decline on Monday and by the end of the day had reached the support zone of 1.3425–1.3444. A rebound from this

Samir Klishi 11:30 2025-07-15 UTC+2

Despite the potential for a correction to its nearest support level, USD/CHF still has the potential to return to its bullish bias on Tuesday, July 15, 2025.

USD/CHF - Tuesday, July 15, 2025. With the Golden Cross condition between EMA(50) and EMA(200) indicates that buyers still dominate, although there is potential for a correction in the near

Arief Makmur 07:31 2025-07-15 UTC+2

If the Fiber strengthening is held at its Resistance 1 level, EUR/USD has the potential to weaken again on Tuesday, July 15, 2025.

EUR/USD - Tuesday, July 15, 2025. Although the RSI(14) is at 55.39 (Neutral-Bullish), the EMA(50) is below the EMA(200), indicating that despite the upward retracement, the potential for a continued

Arief Makmur 07:31 2025-07-15 UTC+2

EUR/USD Forecast for July 15, 2025

On the daily chart, the price has consolidated below the 1.1692 level. The Marlin oscillator is currently entering the territory of a downward trend. The target at 1.1535

Laurie Bailey 05:12 2025-07-15 UTC+2

GBP/USD Forecast for July 15, 2025

By the end of Monday, the British pound consolidated below the balance indicator line, having approached the target support level at 1.3369 by 65 points. The signal line

Laurie Bailey 05:12 2025-07-15 UTC+2

USD/JPY Forecast for July 15, 2025

Following a rebound from the support level at 146.11, the USD/JPY pair has reached the upper line of the wedge pattern on the daily chart and is now targeting

Laurie Bailey 05:12 2025-07-15 UTC+2

USD/JPY. Analysis and Forecast

The USD/JPY pair remains in a consolidation phase near a three-week high, supported by U.S. dollar strength and mixed market signals. The dollar is being bolstered by U.S. President Donald

Irina Yanina 12:17 2025-07-14 UTC+2
Can't speak right now?
Ask your question in the chat.
 

Dear visitor,

Your IP address shows that you are currently located in the USA. If you are a resident of the United States, you are prohibited from using the services of InstaFintech Group including online trading, online transfers, deposit/withdrawal of funds, etc.

If you think you are seeing this message by mistake and your location is not the US, kindly proceed to the website. Otherwise, you must leave the website in order to comply with government restrictions.

Why does your IP address show your location as the USA?

  • - you are using a VPN provided by a hosting company based in the United States;
  • - your IP does not have proper WHOIS records;
  • - an error occurred in the WHOIS geolocation database.

Please confirm whether you are a US resident or not by clicking the relevant button below. If you choose the wrong option, being a US resident, you will not be able to open an account with InstaTrade anyway.

We are sorry for any inconvenience caused by this message.