See also
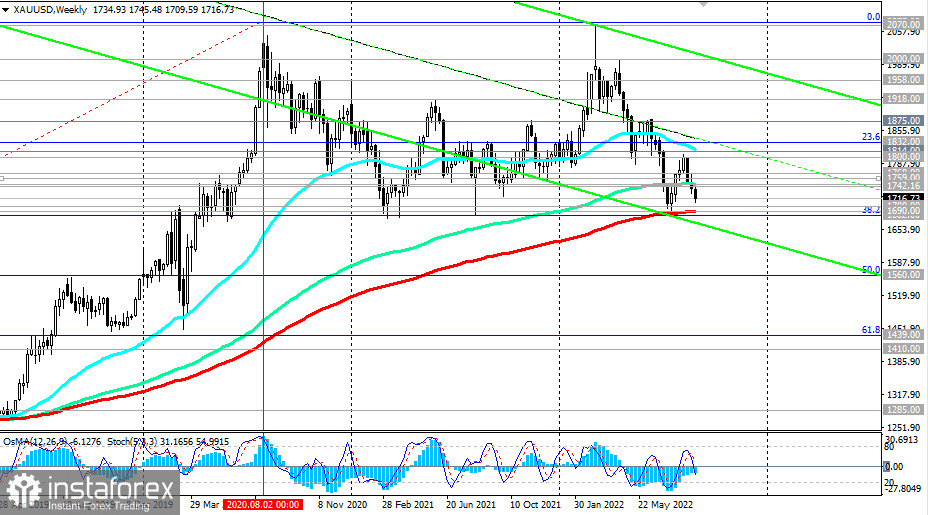
Gold is giving way to its role as a defensive asset to the dollar, and the XAU/USD pair is declining towards the key support levels of 1700.00, 1690.00 (200 EMA on the weekly chart), 1682.00 (38.2% Fibonacci retracement correction to the growth wave since December 2015 and the 1050.00 mark).
In the event of their breakdown, the long-term bullish trend of the XAU/USD pair may be in jeopardy.
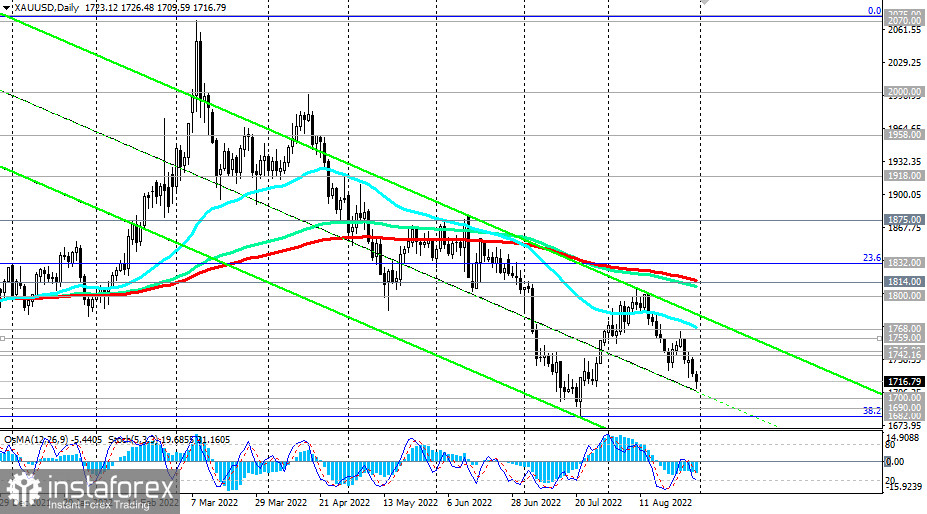
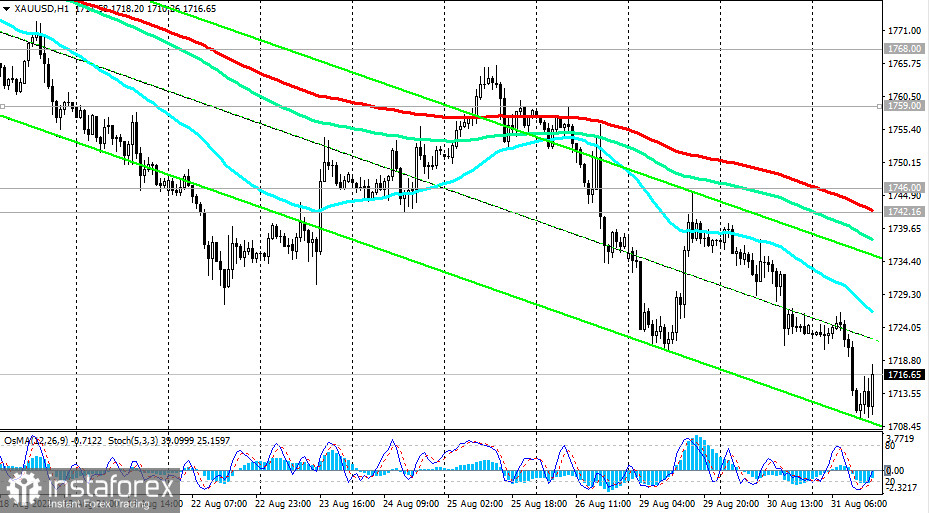
In an alternative scenario, there will be a rebound from these support levels, and a breakdown of the important resistance levels of 1742.00 (200 EMA on the 1-hour chart), 1746.00 (144 EMA on the weekly chart) will become a signal for the resumption of long positions. The breakdown of the key resistance level 1814.00 (200 EMA on the daily chart) will confirm the scenario of the resumption of the long-term bullish trend of XAU/USD.
Support levels: 1700.00, 1690.00, 1682.00
Resistance levels: 1742.00, 1746.00, 1759.00, 1768.00, 1800.00, 1814.00, 1832.00, 1875.00
Trading Tips
Sell Stop 1708.00. Stop-Loss 1727.00. Take-Profit1700.00, 1690.00, 1682.00
Buy Stop 1727.00. Stop-Loss 1708.00. Take-Profit 1742.00, 1746.00, 1759.00, 1768.00, 1800.00, 1814.00, 1832.00, 1875.00
You have already liked this post today
*The market analysis posted here is meant to increase your awareness, but not to give instructions to make a trade.
Wednesday Trade Analysis: GBP/USD – 1H Chart On Wednesday, the GBP/USD pair was also stuck in a flat movement, with very low volatility. There were virtually no price movements during
Wednesday Trade Analysis: EUR/USD – 1H Chart On Wednesday, the EUR/USD pair continued to trade in line with the prevailing trend from the previous week. Market activity was minimal throughout
On Wednesday, GBP/USD remained within its descending channel. However, a more interesting setup emerged in the 4-hour time frame, where the price attempted several times to break through the Senkou
On Wednesday, the EUR/USD pair continued moving within a weak downward channel, as previously forecast. However, volatility dropped to a minimum, there was no macroeconomic backdrop for the third consecutive
On Tuesday, the GBP/USD pair continued its moderate downward movement, which is clearly of a technical and corrective nature. On both Monday and Tuesday, there were no significant macroeconomic events
On Tuesday, the EUR/USD currency pair continued its mild downward movement in line with the prevailing trend. After a fairly strong upward move, the market began a correction. The nature
Monday Trade Analysis: GBP/USD 1H chart On Monday, the GBP/USD pair was clearly trading sideways. On the hourly timeframe, it consolidated below the ascending trendline, but in our view, this
Monday Trade Review: EUR/USD, 1H Chart On Monday, the EUR/USD pair traded with a downward bias, and the U.S. dollar posted a fairly strong gain. As we've mentioned before, even
E-mail/SMS
notifications
Your IP address shows that you are currently located in the USA. If you are a resident of the United States, you are prohibited from using the services of InstaFintech Group including online trading, online transfers, deposit/withdrawal of funds, etc.
If you think you are seeing this message by mistake and your location is not the US, kindly proceed to the website. Otherwise, you must leave the website in order to comply with government restrictions.
Why does your IP address show your location as the USA?
Please confirm whether you are a US resident or not by clicking the relevant button below. If you choose the wrong option, being a US resident, you will not be able to open an account with InstaTrade anyway.
We are sorry for any inconvenience caused by this message.