See also
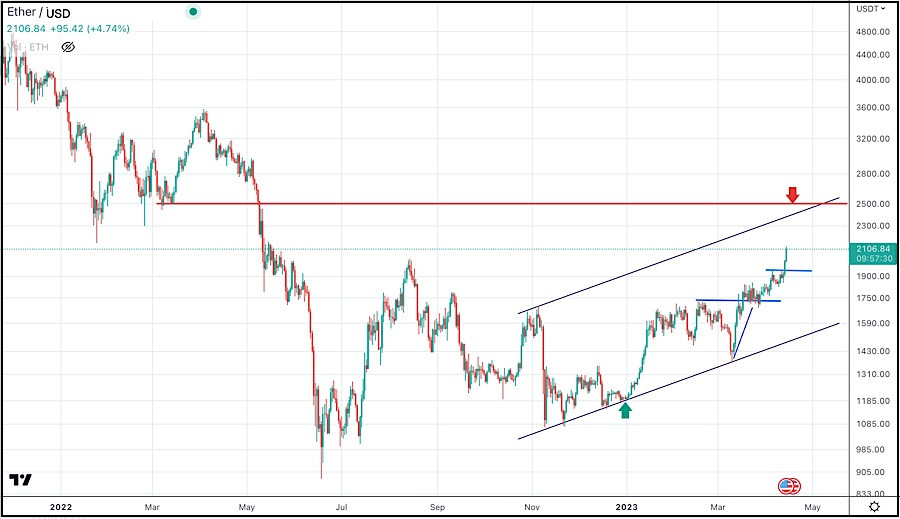
Ethereum has been one of the best-performing cryptocurrencies in the market, with significant gains since the beginning of the year. The recent technical analysis of the Ethereum/USD chart shows a potential bullish trend in the near future.
The updated technical analysis of the Ethereum/USD chart indicates that Ethereum has broken out of a key resistance level against USD, which could lead to further gains.
The cryptocurrency is trading within an ascending channel on the USD chart, signaling a potential bullish move.
Ethereum is trading above its 50-day moving average, indicating a bullish trend. However, the Relative Strength Index (RSI) is approaching overbought levels, which indicates a potential correction.
Hence, Ethereum may experience a pullback before continuing its upward trend against USD.
Traders should keep an eye on the price action around the 2500$ level, as it is a key resistance level. A break above this level could lead to further gains towards the 3000$ level. Conversely, a break below the 2000 $ support level could lead to a short-term bearish trend.
In summary, Ethereum against USD chart points to further continuation of the ongoing bullish trend, with a key resistance level at 2500.
Traders should be cautious and wait for confirmation of the bullish trend before entering any long positions.
You have already liked this post today
*The market analysis posted here is meant to increase your awareness, but not to give instructions to make a trade.
Useful links: My other articles are available in this section InstaForex course for beginners Popular Analytics Open trading account Important: The begginers in forex trading need to be very careful
Nasdaq 100 Index – Thursday, July 31, 2025. With the Golden Cross of the 50-day (EMA)50 and (EMA)200 and the position of RSI (14)in an Extreme Bullish condition, the Nasdaq
EUR/GBP – Thursday, July 31, 2025. With the 50-day moving average (EMA) condition below the 200-day moving average (EMA) and supported by the appearance of "Hidden Divergence" from
If the euro continues its downtrend, it could reach the 5/8 Murray level at 1.1352. This level could provide an opportunity for a technical rebound, as the indicators are showing
Early in the European session, gold is trading around 3,296, bouncing after reaching the area of 3,268, a key level that gave it a strong technical rebound. We now expect
If Bitcoin consolidates above $119,000 in the coming days, it could signal a bullish move. So, we believe it could reach the 7/8 Murray level at 121,878 and even
E-mail/SMS
notifications
Your IP address shows that you are currently located in the USA. If you are a resident of the United States, you are prohibited from using the services of InstaFintech Group including online trading, online transfers, deposit/withdrawal of funds, etc.
If you think you are seeing this message by mistake and your location is not the US, kindly proceed to the website. Otherwise, you must leave the website in order to comply with government restrictions.
Why does your IP address show your location as the USA?
Please confirm whether you are a US resident or not by clicking the relevant button below. If you choose the wrong option, being a US resident, you will not be able to open an account with InstaTrade anyway.
We are sorry for any inconvenience caused by this message.