empty
14.09.2022 07:29 PM
Technical analysis of EUR/USD for September 14, 2022

This image is no longer relevant

Overview :

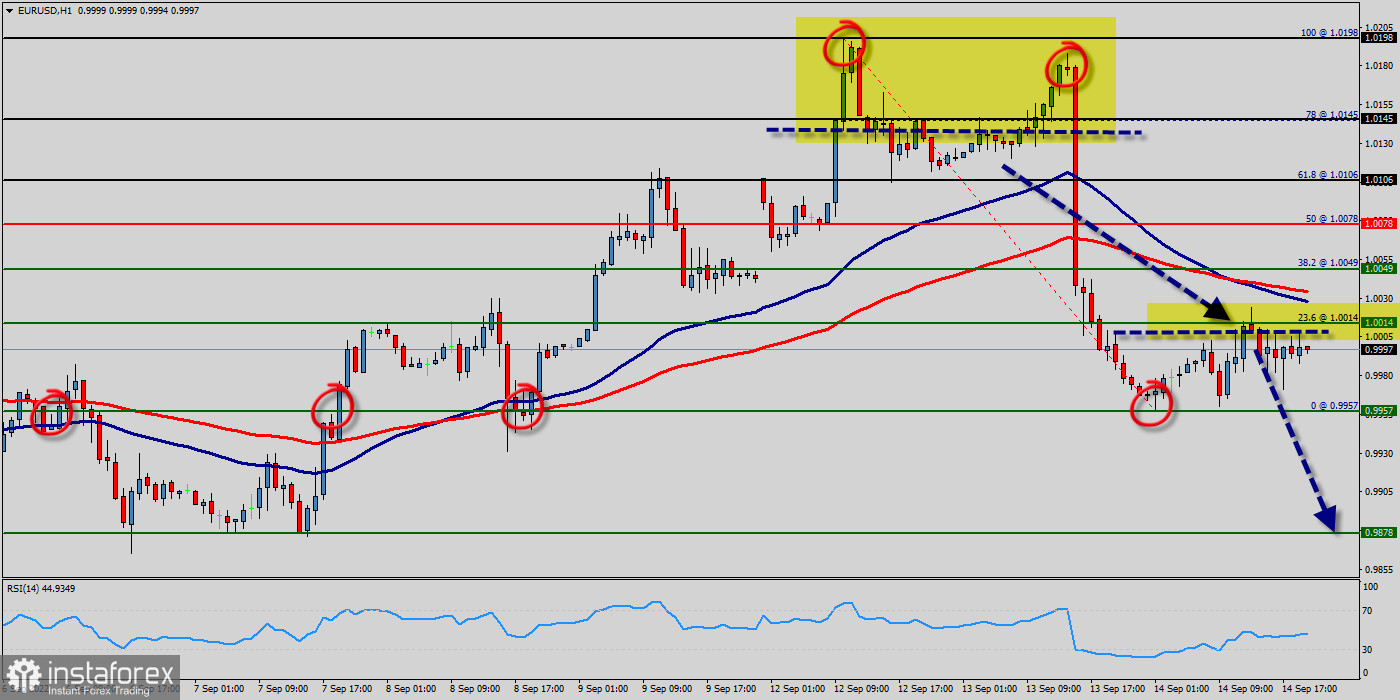
The EUR/USD pair stayed below the psychological level of 1.0078 over the week, indicating a lack of urgency to accumulate at the current levels. The bears are attempting to extend EUR/USD pair's decline below 0.9957 to bottomed at 1 USD right now.

The EUR/USD pair remains downside for consolidation below 1.0078 temporary low. Downside of recovery should be limited by 0.9957 support turned resistance to bring another fall.

The Euro pair depreciated further to 1 USD, the lowest level in this week, falling towards parity against the dollar on concerns the energy crisis would lead Europe's region to a deep recession, placing the ECB between a rock and a hard place as it tries to curb inflation and rest a slowing economy. The EUR/USD pair decreased within adown channel.

It then trimmed losses, dropping to 0.9957. The move lower took place amid a stronger US dollar across the board. Probably, the main scenario is continued decline towards 0.9800 (sentiment level). Some fundamental news will impact on the EUR/USD pair in coming days because The euro has a flexible exchange rate, which is dependent on three factors : The European Central Bank's benchmark interest rate. Additionally, the debt levels of individual countries within the EU. Moreover, the strength of the European economy.

Closing below the pivot point (1.0078) could assure that the EUR/USD pair will move lower towards cooling new lows. Then, the bears must break through the price of 1 USD n order to resume the downtrend.

The trend is still below the 100 EMA for that the bearish outlook remains the same as long as the 100 EMA is headed to the downside. Hence, the price spot of 1.0078 remains a significant resistance zone.

Also it should notice that the Euro is edging lower against the U.S. Dollar late in the session this morning in a volatile session that saw the single currency posting an early loss before continuing after data in the U.S. showed the world's largest economy created more jobs than expected this month.

Since the trend is below the 50% Fibonacci level (1.0078), the market is still in a downtrend. Overall, we still prefer the bearish scenario. Consequently, there is a possibility that the EUR/USD pair will move downside. The structure of a fall does not look corrective.

If the pair fails to pass through the level of 0.9957, the market will indicate a bearish opportunity below the strong resistance level of 1.0078.

The trend is still calling for a strong bearish market from the spot of 1.0078. Sellers are asking for a high price. In this regard, sell deals are recommended lower than the 1.0078 level with the first target at 0.9957.

It is possible that the pair will carry on downwards continuing the development of the bearish trend to the level 0.9878.

However, stop loss has always been in consideration thus it will be useful to set it above the last double top at the level of 1.0198 (notice that the major resistance today has set at 1.0198). Please check out the market volatility before investing, because the sight price may have already been reached and scenarios might have become invalidated.

Recommended Stories

USD/JPY. Analysis and Forecast

Technically speaking, the price holding above the round-number level of 148.00 paves the way for continued growth in the USD/JPY currency pair. Additionally, daily chart oscillators remain in positive territory

Irina Yanina 21:45 2025-09-22 UTC+2

Forecast for EUR/USD on September 22, 2025

On Friday, the EUR/USD pair continued its decline after bouncing off the 1.1789–1.1802 zone. The decline in the euro may continue toward the 76.4% corrective level at 1.1695

Samir Klishi 11:45 2025-09-22 UTC+2

Forecast for GBP/USD on September 22, 2025

On the hourly chart, the GBP/USD pair continued its decline on Friday after consolidating below the 1.3587–1.3620 zone and ended the day with a close below the 76.4% Fibonacci level

Samir Klishi 11:36 2025-09-22 UTC+2

GBP/USD. Technical Analysis for the Week of September 22–27

Last week, the pair moved upward toward the Bollinger Band line at 1.3721 (black dashed line), and then the price turned downward, closing the weekly candle at 1.3466

Stefan Doll 11:24 2025-09-22 UTC+2

EUR/USD. Technical Analysis for the Week of September 22–27

Last week, the pair moved upward and tested the 161.8% target level at 1.1886 (red dashed line), after which the price moved down, closing the weekly candle at 1.1745

Stefan Doll 11:21 2025-09-22 UTC+2

GBP/USD Indicator Analysis on September 22, 2025

On Friday, the pair moved downward, breaking through the 61.8% retracement level at 1.3465 (blue dashed line), and closed the daily candle at 1.3462. Today, the price will attempt

Stefan Doll 11:14 2025-09-22 UTC+2

EUR/USD. Indicator Analysis on September 22, 2025

On Friday, the pair moved downward. The 13-period EMA – 1.1698 (yellow thin line) turned upward, closing the daily candle at 1.1745. Today, the pair will attempt to begin upward

Stefan Doll 11:10 2025-09-22 UTC+2

Forex forecast 22/09/2025: EUR/USD, GBP/USD, USD/JPY, Gold, Ethereum and Bitcoin

Useful links: My other articles are available in this section InstaForex course for beginners Popular Analytics Open trading account Important: The begginers in forex trading need to be very careful

Sebastian Seliga 10:41 2025-09-22 UTC+2

USDX today has the potential to strengthen up to the nearest Resistance level. Monday, September 22, 2025.

[USDX] – [Monday, September 22, 2025] With the RSI in the Neutral-Bullish area and supported by both EMAs forming a Golden Cross, #USDX is likely to strengthen to its nearest

Arief Makmur 07:31 2025-09-22 UTC+2

There is potential weakness in Crude Oil today down to its nearest Support level. Monday, September 22, 2025.

[Crude Oil] – [Monday, September 22, 2025] Although the RSI is in the Neutral-Bullish area, but with both EMAs crossing in a Death Cross configuration, #CL is likely to weaken

Arief Makmur 07:31 2025-09-22 UTC+2
Can't speak right now?
Ask your question in the chat.
 

Dear visitor,

Your IP address shows that you are currently located in the USA. If you are a resident of the United States, you are prohibited from using the services of InstaFintech Group including online trading, online transfers, deposit/withdrawal of funds, etc.

If you think you are seeing this message by mistake and your location is not the US, kindly proceed to the website. Otherwise, you must leave the website in order to comply with government restrictions.

Why does your IP address show your location as the USA?

  • - you are using a VPN provided by a hosting company based in the United States;
  • - your IP does not have proper WHOIS records;
  • - an error occurred in the WHOIS geolocation database.

Please confirm whether you are a US resident or not by clicking the relevant button below. If you choose the wrong option, being a US resident, you will not be able to open an account with InstaTrade anyway.

We are sorry for any inconvenience caused by this message.