empty
18.10.2021 11:02 AM
USD/JPY technical analysis for October 18, 2021

Last week, the Japanese yen became one of the major currencies that showed a decline against the US dollar. At the same time, it should be noted that the dollar/yen currency pair showed rather impressive growth. Perhaps this is caused by the aggravated epidemiological situation in the world, where the fourth wave of COVID-19 is rampant. It is unknown how many more waves of this hated and annoying pandemic will be. However, during the exacerbation of COVID-19, it was the US dollar that investors preferred and still prefer as a protective asset. This factor likely caused the growth of the USD/JPY pair. However, since this review is devoted to the technical component, we proceed to analyze price charts, and let's start with a weekly scale.

Weekly

This image is no longer relevant

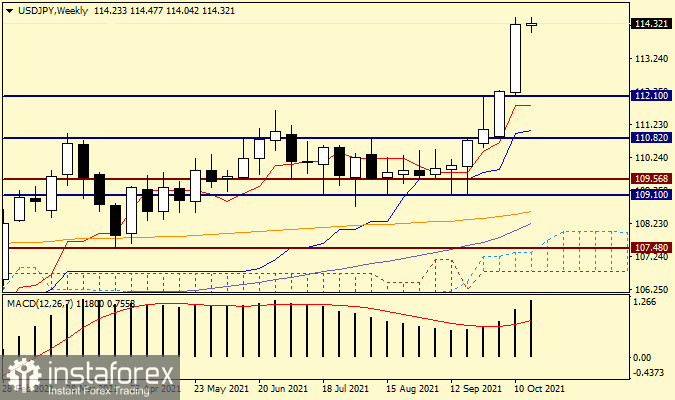
As a result of the impressive growth shown at the auction on October 11-15, a large bullish candle appeared on the weekly chart with a closing price of 114.26. Thus, the hated resistance of sellers in the area of 112.00-112.25 was more than confidently broken through. However, one should not discount another interesting and quite strong mark of 113.00. We may see a pullback to this significant level during the trading of the current five-day period. If this happens, then there will be a good option for buying a pair. However, it is incorrect to determine the points for entering the market using a weekly timeframe. In the absence of the expected pullback and continuation of the rise from current prices, another landmark psychological level of 115.00 looms on the horizon of buyers. The task of bears in the current situation looks extremely difficult. To take control of the pair, they will need to absorb the hefty last white candle and close the weekly trading below the level of 112.00. In my opinion, such a task is almost impossible, although, as we know, everything happens on the market and nothing is particularly surprising.

Daily

This image is no longer relevant

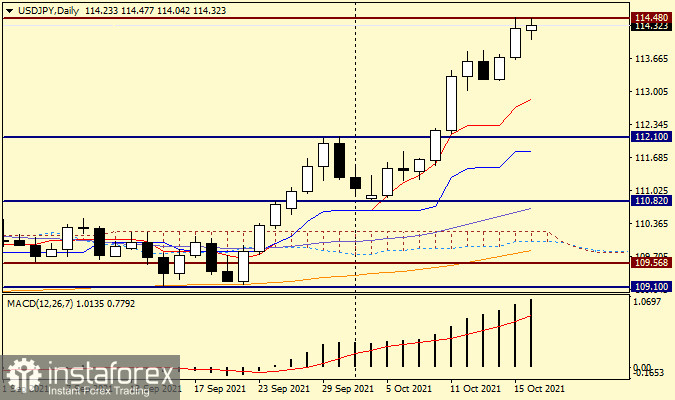
On this chart, all technical indicators turn up following the price, which can be characterized as support for growth and with a high probability of its continuation. The closest to the price (at 112.86) is the red Tenkan line of the Ichimoku indicator, so a pullback to Tenkan could be used to open long positions. However, given that the pair is currently trading near 114.28, such a deep pullback can be perceived as a change of course. As a more acceptable option for purchases, you can use a breakdown of the resistance of 114.48, fixing above this level and rolling back to it, after which you can try opening long positions. I am sure that this week we will return to the consideration of this currency pair. However, for now, I will outline the overall priority, which of course, comes down to purchases. Support levels: 114.00,113.40, and 113.00. Resistance passes at 114.60, 115.00, and 115.40. The general recommendation - we are looking for options to open purchases after corrective pullbacks, possibly to the designated support levels.

Ivan Aleksandrov,
Analytical expert of InstaTrade
© 2007-2025

Recommended Stories

Forex forecast 18/07/2025: EUR/USD, GBP/USD, USD/JPY, Oil, Ethereum and Bitcoin

Useful links: My other articles are available in this section InstaForex course for beginners Popular Analytics Open trading account Important: The begginers in forex trading need to be very careful

Sebastian Seliga 14:51 2025-07-18 UTC+2

GBP/USD. Daily Overview on July 18, 2025

On Thursday, the pair moved downward and nearly tested the lower fractal at 1.3369 (yellow dashed line), then reversed upward and closed the daily candlestick at 1.3412. Today, the pair

Stefan Doll 13:14 2025-07-18 UTC+2

XAU/USD. Analysis and Forecast

Today, gold is rising. The recent price movement within a range observed since the beginning of this month represents the formation of a "rectangle" pattern, indicating trader indecision. In addition

Irina Yanina 13:06 2025-07-18 UTC+2

EUR/USD. Daily Overview on July 18, 2025

On Thursday, the pair moved downward toward the 61.8% retracement level at 1.1650 (red dashed line), then reversed upward, closing the daily candlestick at 1.1560. Today, the price may continue

Stefan Doll 12:49 2025-07-18 UTC+2

Forecast for EUR/USD on July 18, 2025

On Thursday, the EUR/USD pair returned to the 100.0% corrective level at 1.1574 and bounced off it for the second time in a row. This resulted in a reversal

Samir Klishi 12:16 2025-07-18 UTC+2

Forecast for GBP/USD on July 18, 2025

On the hourly chart, the GBP/USD pair on Thursday returned to the support zone of 1.3357–1.3371 and bounced off it again. This resulted in a reversal in favor

Samir Klishi 11:49 2025-07-18 UTC+2

Trading Signals for EUR/USD for July 18-21, 2025: buy above 1.1596 (200 EMA - 7/8 Murray)

Given that the eagle indicator is showing potential for a possible recovery for the euro, we will look for buying opportunities whenever the euro pulls back and trades above 1.1596

Dimitrios Zappas 08:22 2025-07-18 UTC+2

Trading Signals for BITCOIN for July 18-21, 2025: buy above $118,000 (6/8 Murray - 21 SMA)

If Bitcoin makes a technical correction toward the support at 118,750 or the secondary uptrend channel around 118,200 in the coming hours, this will be seen as a buying opportunity

Dimitrios Zappas 08:22 2025-07-18 UTC+2

Trading Signals for GOLD (XAU/USD) for July 18-21, 2025: buy above $3,330 (21 SMA - 5/8 Murray)

Conversely, if gold falls below 3,320 and breaks the uptrend channel, we could expect a trend reversal, and it may reach the 4/8 Murray line at 3,281, eventually reaching

Dimitrios Zappas 07:23 2025-07-18 UTC+2

If XAU/USD successfully breaks through and closes below the Pivot, it has the potential to continue its decline to the next support level, Friday, July 18, 2025.

XAU/USD – Friday, July 18, 2025. The potential for XAU/USD to weaken continues, as reflected in The EMA (50) is below the EMA (200) and the RSI (14)

Arief Makmur 07:02 2025-07-18 UTC+2
Can't speak right now?
Ask your question in the chat.
 

Dear visitor,

Your IP address shows that you are currently located in the USA. If you are a resident of the United States, you are prohibited from using the services of InstaFintech Group including online trading, online transfers, deposit/withdrawal of funds, etc.

If you think you are seeing this message by mistake and your location is not the US, kindly proceed to the website. Otherwise, you must leave the website in order to comply with government restrictions.

Why does your IP address show your location as the USA?

  • - you are using a VPN provided by a hosting company based in the United States;
  • - your IP does not have proper WHOIS records;
  • - an error occurred in the WHOIS geolocation database.

Please confirm whether you are a US resident or not by clicking the relevant button below. If you choose the wrong option, being a US resident, you will not be able to open an account with InstaTrade anyway.

We are sorry for any inconvenience caused by this message.