See also
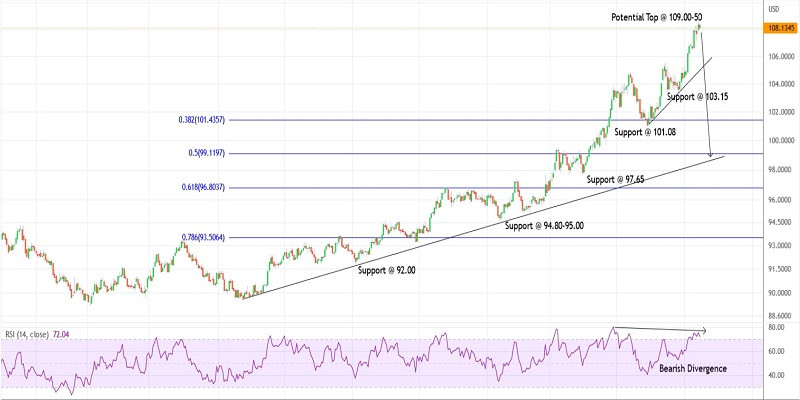
The US dollar index continued to defy resistance and topped the 109.00 level on Thursday before easing off. The index is seen to be trading below 108.00 and potential remains for a drag towards the 107.00-10 initial support in the near term. It could be the first step towards a larger-degree bearish reversal towards 101.00.
The US dollar index has risen meticulously since January 06, 2021, printing the 89.20 low as seen on the daily chart. It has produced a religious rally between 89.20 and 109.00, carving higher highs and higher lows and might have already terminated its rise. Ideally, the entire rally should be retraced and prices should drop towards 97.00 in the next several weeks.
The US dollar index bears are now poised to come back in control and hold prices below the 109.00 interim resistance. Also, note that a potential shooting star candlestick pattern was complete on the daily chart indicating a potential reversal ahead. The initial support is seen at around 103.15, followed by 101.00 which could be potential targets.
The US dollar index has been printing recent highs accompanied by a strong bearish divergence on the daily RSI as seen here. The recent high at 109.00 has seen the RSI dropping, indicating a potential trend reversal ahead. Bears might be preparing to come back strong enough from the current levels and drag the price towards 101.00 at least, which is the Fibonacci 0.382 retracement of the entire rally.
Potential drop towards 101.00 against 109.00
Good luck!
You have already liked this post today
*The market analysis posted here is meant to increase your awareness, but not to give instructions to make a trade.
Thursday Trade Review: GBP/USD, 1H Chart On Thursday, the GBP/USD pair continued its downward movement, mirroring the EUR/USD pair. The behavior of these two major currency pairs was nearly identical
EUR/USD 5M Analysis On Thursday, the EUR/USD currency pair continued its sluggish decline, completely ignoring the fundamental backdrop. As a reminder, this week Donald Trump announced new tariffs targeting both
Wednesday Trade Analysis: GBP/USD – 1H Chart On Wednesday, the GBP/USD pair was also stuck in a flat movement, with very low volatility. There were virtually no price movements during
Wednesday Trade Analysis: EUR/USD – 1H Chart On Wednesday, the EUR/USD pair continued to trade in line with the prevailing trend from the previous week. Market activity was minimal throughout
On Wednesday, GBP/USD remained within its descending channel. However, a more interesting setup emerged in the 4-hour time frame, where the price attempted several times to break through the Senkou
On Wednesday, the EUR/USD pair continued moving within a weak downward channel, as previously forecast. However, volatility dropped to a minimum, there was no macroeconomic backdrop for the third consecutive
On Tuesday, the GBP/USD pair continued its moderate downward movement, which is clearly of a technical and corrective nature. On both Monday and Tuesday, there were no significant macroeconomic events
On Tuesday, the EUR/USD currency pair continued its mild downward movement in line with the prevailing trend. After a fairly strong upward move, the market began a correction. The nature
InstaTrade in figures
Your IP address shows that you are currently located in the USA. If you are a resident of the United States, you are prohibited from using the services of InstaFintech Group including online trading, online transfers, deposit/withdrawal of funds, etc.
If you think you are seeing this message by mistake and your location is not the US, kindly proceed to the website. Otherwise, you must leave the website in order to comply with government restrictions.
Why does your IP address show your location as the USA?
Please confirm whether you are a US resident or not by clicking the relevant button below. If you choose the wrong option, being a US resident, you will not be able to open an account with InstaTrade anyway.
We are sorry for any inconvenience caused by this message.