See also
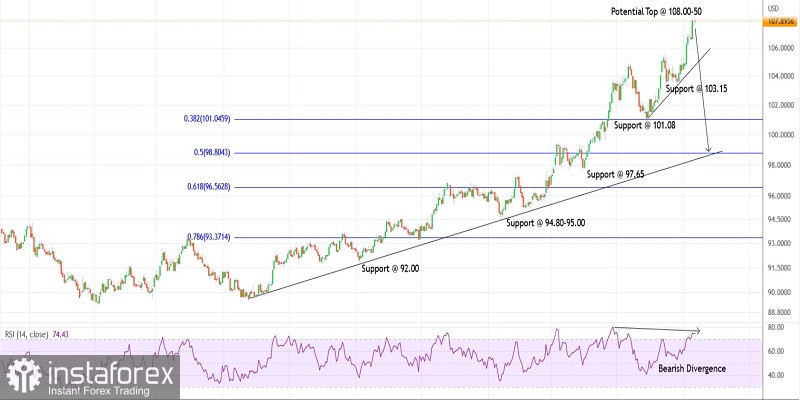
The US dollar index climbed towards 108.30 on Tuesday before reversing sharply lower to 107.53 intraday. The index oscillated within the 80-pips range producing a Doji candlestick pattern on the daily chart. A high probability remains for a bearish Evening Star candlestick pattern indicating a potential trend reversal. We will be able to recognize it according to further price action.
The US dollar index has remained in control of bulls since January 06, 2021, after printing lows at around 89.20. The index has remained in a religious uptrend thereafter, carving a series of higher highs and higher lows towards 108.30 recently. The entire rally seems complete or close to complete. Hence, a probability remains for a meaningful corrective drop to unfold going forward.
The US dollar index is looking to drag lower towards the 101.00 support, which is also the Fibonacci 0.382 retracement of the entire rally between 89.20 and 108.30. A break below 103.15 will be encouraging for bears and could be the first step towards a larger correction. Also, note that prices could drop towards the Fibonacci 0.618 retracement that matches the 95.00-96.00 zone.
The US dollar index has potentially terminated a larger-degree upswing towards 108.30. Furthermore, recent highs have been accompanied by a bearish divergence on the daily RSI. This could be viewed as a strong indicator of a potential trend reversal towards 101.00 at least. The bottom line for the above is that prices should stay below 108.30.
Potential drop towards 101.00 against 108.50
Good luck!
You have already liked this post today
*The market analysis posted here is meant to increase your awareness, but not to give instructions to make a trade.
Analysis of Monday's Trades 1H Chart of GBP/USD On Monday, the GBP/USD pair continued its downward movement. Recently, the euro and the pound have shown low correlation, as the euro
Analysis of Monday's Trades 1H Chart of EUR/USD On Monday, the EUR/USD currency pair formally continued its downward movement but in practice traded sideways with low volatility for the second
The GBP/USD currency pair continued its downward movement throughout Monday. Despite the absence of macroeconomic news in both the UK and the US, the market still found new reasons
The EUR/USD currency pair moved sideways throughout Monday. In our previous article, we anticipated that there wouldn't be a strong move on the first trading day of the week
Analysis of Friday's Trades 1H Chart of GBP/USD The GBP/USD pair traded with a relatively substantial decline on Friday. Why did the British pound fall again while the euro remained
Analysis of Friday's Trades 1H Chart of EUR/USD On Friday, the EUR/USD currency pair continued its mild downward movement, in line with the current trend. We've been saying the same
The GBP/USD currency pair continued its downward movement throughout Friday. We cannot say there were strong reasons for this, but in the morning, the UK released reports on GDP (monthly
Thursday Trade Review: GBP/USD, 1H Chart On Thursday, the GBP/USD pair continued its downward movement, mirroring the EUR/USD pair. The behavior of these two major currency pairs was nearly identical
Your IP address shows that you are currently located in the USA. If you are a resident of the United States, you are prohibited from using the services of InstaFintech Group including online trading, online transfers, deposit/withdrawal of funds, etc.
If you think you are seeing this message by mistake and your location is not the US, kindly proceed to the website. Otherwise, you must leave the website in order to comply with government restrictions.
Why does your IP address show your location as the USA?
Please confirm whether you are a US resident or not by clicking the relevant button below. If you choose the wrong option, being a US resident, you will not be able to open an account with InstaTrade anyway.
We are sorry for any inconvenience caused by this message.