See also

 21.04.2022 05:34 PM
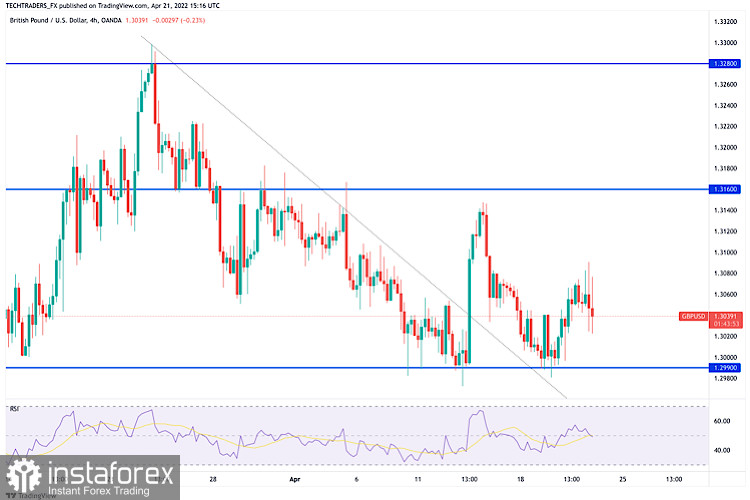
GBP/USD has edged higher on the back of hawkish comments from BOE policymaker Catherine Mann in the early American session but quickly changed course as the greenback is back in fashion.
GBP/USD is trading slightly above the 100-period SMA on the four-hour chart and the Relative Strength Index (RSI) indicator holds at 60, confirming the bullish bias. On the upside, 1.3100 (200-period SMA, psychological level) aligns as the next resistance. In case this level turns into support, additional gains toward 1.3130 (static level) could be witnessed.
On the flip side, a daily close below 1.3050 (static level) could cause buyers to move to the sidelines. In that case, 1.3020 (20-period SMA) and 1.3000 (psychological level) could be seen as next support levels.
You have already liked this post today
*The market analysis posted here is meant to increase your awareness, but not to give instructions to make a trade.


