See also

 12.05.2026 09:00 AM
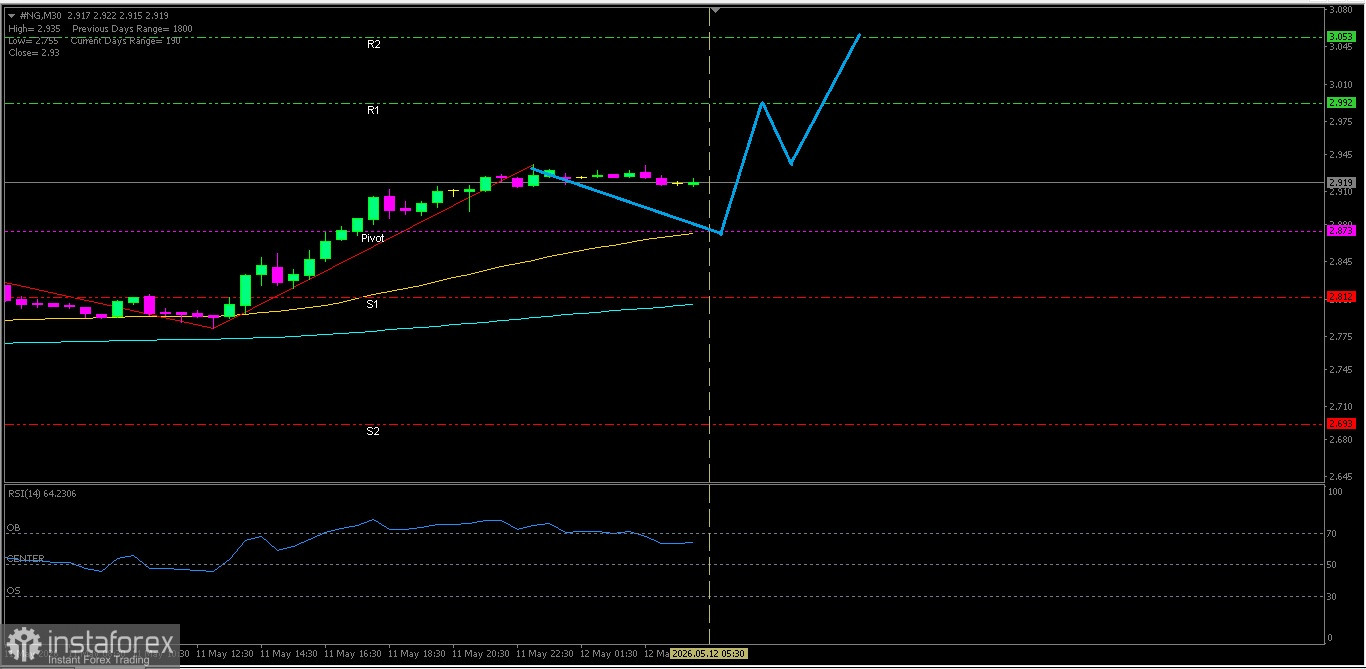
NATURAL GAS
With RSI(14) indicator position in the Neutral-Bullish area and both EMAs which forming a Golden Cross, then there is potential for #NG to test its nearest resistance level.
Key Levels
1. Resistance. 2 : 3.053
2. Resistance. 1 : 2.992
3. Pivot : 2.873
4. Support. 1 : 2.812
5. Support. 2 : 2.693
Tactical Scenario
Positive Reaction Zone: If #NG holds and does not break below 2.873, Natural Gas may move up toward 2.992.
Momentum Extension Bias: If 2.992 is broken out to the upside, there is potential to test 3.053.
Invalidation Level / Bias Revision
The upside bias weakens if price falls below 2.693.
Technical Summary
EMA(50) : 2.871
EMA(200): 2.805
RSI(14) : 64.23
Economic News Release Agenda:
Today the United States will release the following economic data:
US - NFIB Small Business Index - 17:00 WIB
US - ADP Weekly Employment Change - 19:15 WIB
US - Core CPI m/m - 19:30 WIB
US - CPI m/m - 19:30 WIB
US - CPI y/y - 19:30 WIB
US - 10-y Bond Auction - 00:01 WIB
US - Federal Budget Balance - 01:00 WIB
US - API Weekly Statistical Bulletin - 03:30 WIB
You have already liked this post today
*The market analysis posted here is meant to increase your awareness, but not to give instructions to make a trade.


