See also
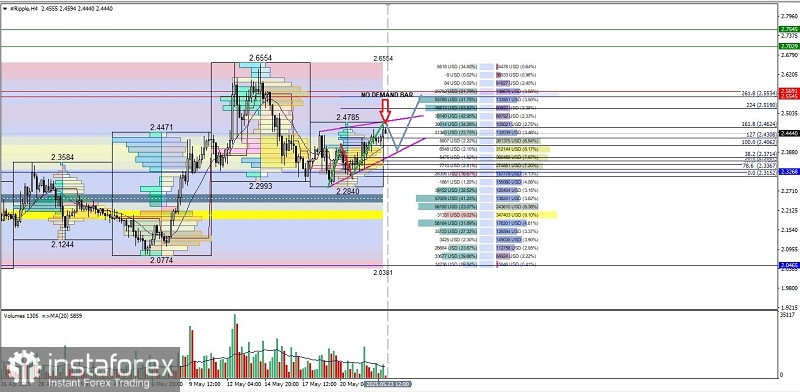
If we look at the 4-hour chart of the Ripple cryptocurrency, it appears to be moving above the WMA (21) which has a steep slope and has successfully broken out above the High Value Area level (yellow) and then continues to move above the blue area (average) and is in the BUYERS sentiment area which is quite significant, then in the near future Ripple has the potential to strengthen up to the level of 2.5190 as its first target and if the volatility and momentum of its strengthening support it, then 2.5534 will be the second target that Ripple will aim for, but it is also necessary to pay attention to the potential for a weakening correction indicated by the appearance of the Rising Wedge pattern and "No Demand Bar" where the distance of the last small Candle body is followed by the last volume bar which is lower than the previous 2 volume bars, thus giving a signal indicating a "Sign Of Weakness (SOS) but as long as the weakening correction does not break and close below the level of 2.2840, the strengthening scenario for Ripple that has been described previously will continue.
(Disclaimer)
You have already liked this post today
*The market analysis posted here is meant to increase your awareness, but not to give instructions to make a trade.
Earlier this week, many were worried that Bitcoin might plunge sharply toward the 110,000 level, fearing a deeper correction toward 100,000. However, market sentiment has since shifted in the opposite
Cardano – Friday, August 08, 2025. With the EMA(50) positioned above the EMA(200) and the RSI(14) indicator in Extreme-Bullish conditions, it appears that buyers are currently dominant. However, the appearance
Uniswap – Friday, August 08, 2025. The Golden Cross condition of both EMAs and the RSI(14) in the Neutral-Bullish area indicates potential for strengthening today. However, the appearance
Bitcoin remains within a newly formed sideways channel, once again attempting yesterday to break above the 115,500 level. Ethereum also shows resilience, which is confirmed by recent activity metrics
Bitcoin continues to trade within a new sideways channel, and its inability to hold above $115,000 indicates a high likelihood of continued correction. Another decline toward the $112,000 level
Yesterday's failure to break above the $115,000 level—even amid a strong correction observed in the second half of the day—suggests that Bitcoin's decline may continue and that larger pullbacks toward
Bitcoin and Ethereum started August on a rather bearish note. Following a sharp drop in the U.S. stock market last Friday, the cryptocurrency market also moved downward, once again demonstrating
Bitcoin and Ethereum saw a significant decline, ending the month with profit-taking. Despite the correction, July was fairly positive—especially for Ethereum, which gained over 49% in price. Bitcoin rose
Your IP address shows that you are currently located in the USA. If you are a resident of the United States, you are prohibited from using the services of InstaFintech Group including online trading, online transfers, deposit/withdrawal of funds, etc.
If you think you are seeing this message by mistake and your location is not the US, kindly proceed to the website. Otherwise, you must leave the website in order to comply with government restrictions.
Why does your IP address show your location as the USA?
Please confirm whether you are a US resident or not by clicking the relevant button below. If you choose the wrong option, being a US resident, you will not be able to open an account with InstaTrade anyway.
We are sorry for any inconvenience caused by this message.