empty
29.07.2024 08:05 AM
Technical Analysis of Intraday Price Movement of Silver Commodity Asset, Monday July 29 2024.

This image is no longer relevant

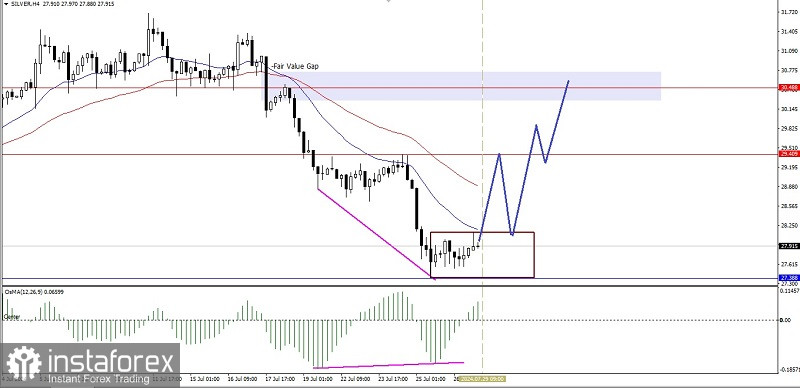
Although on the 4-hour chart, the Silver commodity asset is in a Sideways condition but under Seller pressure as indicated by the EMA 20 which intersects below the EMA 50, but with the appearance of a deviation between the Silver price movement and the MACD Histogram indicator, it gives an indication that in the near future Silver has the potential to be corrected to strengthen to the level of 29,409 and if this level is successfully broken upwards, Silver will continue to strengthen to the level of 30,488 if the momentum and volatility support it, but all of these strengthening correction scenarios will be invalid and canceled by themselves if Silver suddenly returns to its initial bias, especially if it breaks through below 27,388.

(Disclaimer)

Recommended Stories

EUR/USD Forecast for August 7, 2025

As a result of yesterday's 84-pip rise, the euro broke above the target level of 1.1632, testing the balance indicator line. The correction from the downward move that began

Laurie Bailey 05:07 2025-08-07 UTC+2

GBP/USD Forecast for August 7, 2025

By the end of yesterday, the British pound rose by 56 pips, reaching the target level of 1.3364 – the upper boundary of the consolidation range between 1.3253 and 1.3364

Laurie Bailey 05:07 2025-08-07 UTC+2

Natural Gas Forecast for August 7, 2025

On the daily chart, a bullish divergence has formed between the price and the Marlin oscillator. The price has already moved above the target level of 3.086; all that remains

Laurie Bailey 05:07 2025-08-07 UTC+2

XAU/USD – Analysis and Forecast

From a technical standpoint, oscillators on the daily chart are showing positive momentum. Positive signals are also present on the four-hour chart, including a rebound from the 100-period Simple Moving

Irina Yanina 17:53 2025-08-06 UTC+2

Forecast for EUR/USD on August 6, 2025

On Tuesday, the EUR/USD pair continued to trade sideways, mostly above the 100.0% Fibonacci level at 1.1558. This means that the upward movement may still continue toward the 1.1612

Samir Klishi 17:22 2025-08-06 UTC+2

Forecast for GBP/USD on August 6, 2025

On the hourly chart, the GBP/USD pair on Tuesday rebounded from the 127.2% retracement level at 1.3258 (yellow dashed line), reversed in favor of the British pound, and began

Samir Klishi 17:17 2025-08-06 UTC+2

GBP/USD. Indicator Analysis on August 6, 2025

On Tuesday, the pair moved downward to the 14.6% level at 1.3243 (red dashed line), then reversed upward, closing the daily candle at 1.3296. Today, it may continue moving upward

Stefan Doll 17:08 2025-08-06 UTC+2

EUR/USD. Indicator Analysis and Daily Review on August 6, 2025

On Tuesday, the pair moved downward to the 38.2% level at 1.1548 (yellow dashed line), then reversed upward, closing the daily candle at 1.1574. Today, it may continue moving upward

Stefan Doll 17:03 2025-08-06 UTC+2

Forex forecast 06/08/2025: EUR/USD, USD/JPY, GBP/USD, Oil, XRP and Bitcoin

Useful links: My other articles are available in this section InstaForex course for beginners Popular Analytics Open trading account Important: The begginers in forex trading need to be very careful

Sebastian Seliga 12:30 2025-08-06 UTC+2

The divergence between the RSI(14) indicator and the USD/CHF price movement indicates a re-entry of sellers. Wednesday, August 6, 2025.

USD/CHF – Wednesday, August 6, 2025. With the appearance of a divergence between the price movement and the RSI(14) indicator, which is also in a bearish neutral position

Arief Makmur 06:44 2025-08-06 UTC+2
Can't speak right now?
Ask your question in the chat.
 

Dear visitor,

Your IP address shows that you are currently located in the USA. If you are a resident of the United States, you are prohibited from using the services of InstaFintech Group including online trading, online transfers, deposit/withdrawal of funds, etc.

If you think you are seeing this message by mistake and your location is not the US, kindly proceed to the website. Otherwise, you must leave the website in order to comply with government restrictions.

Why does your IP address show your location as the USA?

  • - you are using a VPN provided by a hosting company based in the United States;
  • - your IP does not have proper WHOIS records;
  • - an error occurred in the WHOIS geolocation database.

Please confirm whether you are a US resident or not by clicking the relevant button below. If you choose the wrong option, being a US resident, you will not be able to open an account with InstaTrade anyway.

We are sorry for any inconvenience caused by this message.