Bullish Rectangle
was formed on 28.04 at 01:22:38 (UTC+0)
signal strength 4 of 5
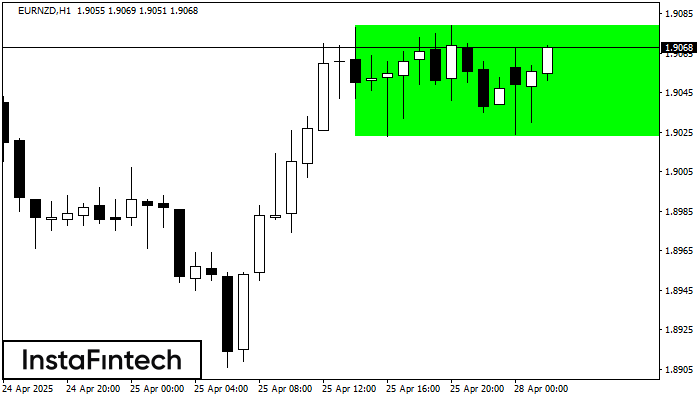
According to the chart of H1, EURNZD formed the Bullish Rectangle which is a pattern of a trend continuation. The pattern is contained within the following borders: the lower border 1.9023 – 1.9023 and upper border 1.9079 – 1.9079. In case the upper border is broken, the instrument is likely to follow the upward trend.
See Also
- All
- All
- Bearish Rectangle
- Bearish Symmetrical Triangle
- Bullish Rectangle
- Double Top
- Double Top
- Triple Bottom
- Triple Bottom
- Triple Top
- Triple Top
- All
- All
- Buy
- Sale
- All
- 1
- 2
- 3
- 4
- 5
बियरिश सिमेट्रिकल त्रिभुज
was formed on 09.09 at 16:57:43 (UTC+0)
signal strength 1 of 5
M5 के चार्ट के अनुसार, GBPAUD से बियरिश सिमेट्रिकल त्रिभुज पैटर्न बना। निचली सीमा 2.0501 भंग होने की स्थिति में यह पैटर्न और नीचे के ट्रेंड की ओर संकेत करता
M5 और M15 समय सीमा में अधिक फाल्स एंट्री पॉइंट्स हो सकते हैं।
Open chart in a new window
हेड एण्ड शोल्डर्स
was formed on 09.09 at 16:00:33 (UTC+0)
signal strength 1 of 5
M5 के चार्ट के अनुसार, GBPCHF से हेड एण्ड शोल्डर्स पैटर्न बना। हेड का टॉप 1.0776 पर सेट है जबकि नेक की मध्य रेखा 1.0762/1.0764 पर मौजूद है। हेड एण्ड
M5 और M15 समय सीमा में अधिक फाल्स एंट्री पॉइंट्स हो सकते हैं।
Open chart in a new window
हेड एण्ड शोल्डर्स
was formed on 09.09 at 15:01:44 (UTC+0)
signal strength 1 of 5
हेड एण्ड शोल्डर्स नामक तकनीकी पैटर्न AUDCHF M5 के चार्ट पर प्रदर्शित हुआ है। वजनदार कारणों से यह सुझाव दिया जाता है कि दाहिना शोल्डर बनने के बाद कीमत नेकलाइन
M5 और M15 समय सीमा में अधिक फाल्स एंट्री पॉइंट्स हो सकते हैं।
Open chart in a new window