

অ্যাকচুয়াল প্যাটার্নস

প্যাটার্ন হলো গ্রাফিক্যাল মডেল, যা মূল্য ওঠানামার ভিত্তিতে চার্টে তৈরি হয়। টেকনিক্যাল বিশ্লেষণের নীতি অনুযায়ী, ইতিহাসের (প্রাইস মুভমেন্ট) পুনরাবৃত্তি ঘটে। অর্থাৎ, পরিস্থিতি যদি একই রকম থাকে তাহলে প্রাইস মুভমেন্টও প্রায় একই রকম হয়। এর ফলে মূল্যের ওঠানামা কেমন হবে তা আগেই থেকেই অনুমান করা যায়।
ইন্সটাফরেক্স এর প্রাসঙ্গিক প্যাটার্নসমূহ সহজেই ব্যবহার করা যায়, যার মাধ্যমে মার্কেটের সর্বশেষ পরিস্থিতি জানা যায় এবং তার উপর ভিত্তি করে সিদ্ধান্ত নেওয়া যায়। আমাদের সেবাগুলো থেকে আপনি যেকোনো পেয়ার এবং টাইমফ্রেমের জন্য সর্বশেষ এবং সবচেয়ে প্রাসঙ্গিক প্যাটার্নগুলো খুঁজে পাবেন।
Double Bottom
was formed on 29.03 at 10:15:29 (UTC+0)
signal strength 1 of 5

The Double Bottom pattern has been formed on #Bitcoin M5. Characteristics: the support level 83619.16; the resistance level 83858.95; the width of the pattern 23979 points. If the resistance level is broken, a change in the trend can be predicted with the first target point lying at the distance of 23772 points.
The M5 and M15 time frames may have more false entry points.
আরও দেখুন
- All
- All
- Bearish Rectangle
- Bearish Symmetrical Triangle
- Bearish Symmetrical Triangle
- Bullish Rectangle
- Double Top
- Double Top
- Triple Bottom
- Triple Bottom
- Triple Top
- Triple Top
- All
- All
- Buy
- Sale
- All
- 1
- 2
- 3
- 4
- 5
Double Bottom
was formed on 22.07 at 19:45:55 (UTC+0)
signal strength 2 of 5
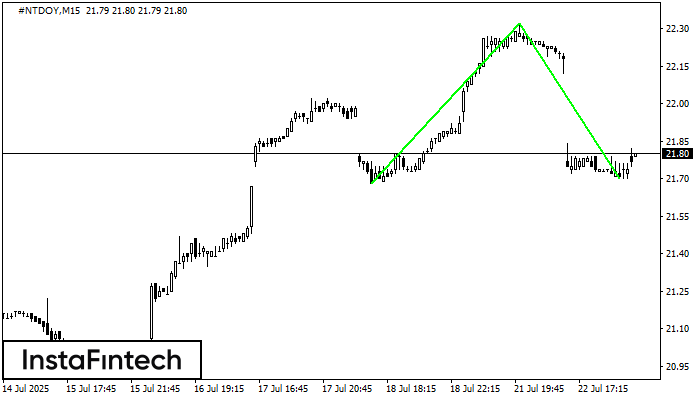
The Double Bottom pattern has been formed on #NTDOY M15; the upper boundary is 22.32; the lower boundary is 21.70. The width of the pattern is 64 points. In case
The M5 and M15 time frames may have more false entry points.
Open chart in a new window
Double Bottom
was formed on 22.07 at 19:45:53 (UTC+0)
signal strength 2 of 5
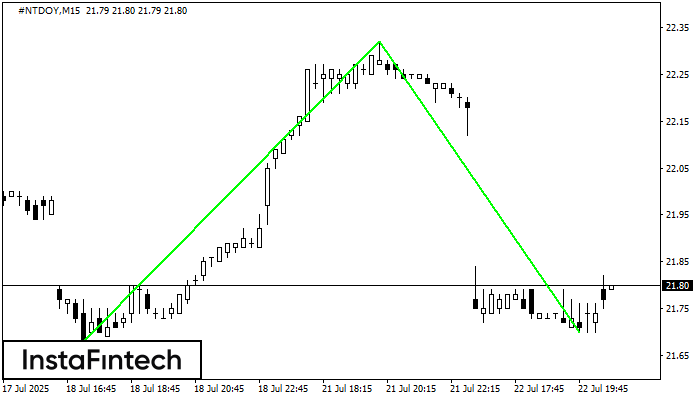
The Double Bottom pattern has been formed on #NTDOY M15. Characteristics: the support level 21.68; the resistance level 22.32; the width of the pattern 64 points. If the resistance level
The M5 and M15 time frames may have more false entry points.
Open chart in a new window
Head and Shoulders
was formed on 21.07 at 21:30:28 (UTC+0)
signal strength 3 of 5
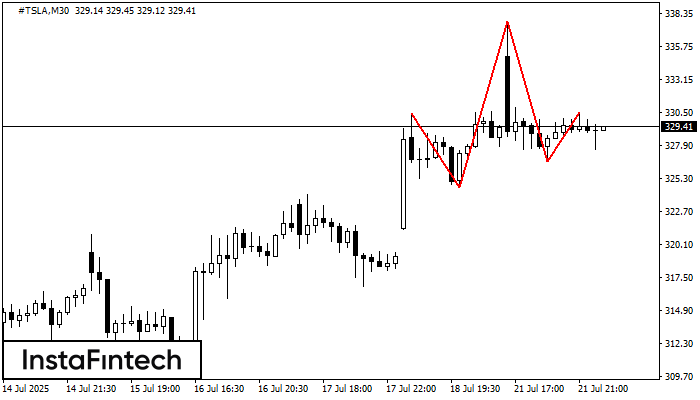
The #TSLA M30 formed the Head and Shoulders pattern with the following features: The Head’s top is at 337.71, the Neckline and the upward angle are at 324.60/326.66. The formation
Open chart in a new window


